Announcing: Valuation as a Service
This is the first of a series of posts this week on our new valuation features

When we started Blinkfire Analytics, the first thing our early team members who had worked in the advertising businesses of the likes of Google, YouTube, and Twitter, as well as many other digital websites, noticed was that digital advertising inventory in the sports world was valued manually by hiring research companies, or by using television audience numbers that couldn’t accurately be measured. This struck us as odd and remarkably inefficient as advertising in the digital world had been operating with digital marketplaces and auctions, at least since Google launched AdWords over ten years ago in 2004.
When we’ve seen these digital valuation reports, they generally list followers and estimates of impressions, and are a printed PDF from data that is months old, and generally stale the day in which the report is delivered. But as you can see in the graph below, it’s normal for these channels to be growing 5-20% each month, so the salespeople were out there negotiating with very old data!
This is somewhat new in the sports world. The number of seats in the stadium is fixed. Television, although changing and expanding in new markets for certain sports (e.g. BPL in the USA) is more seasonal. But audience numbers in digital and social is where rights holders and brands are seeing massive growth. Digital is becoming more and more material to the sponsorship valuation equation, and clearly in the next renewal cycle, the astute rights holders will all have social distribution as a part of their deals.
 |
| Social channels grow from 5-20% over 30 days! |
So we strove to develop something different that would solve this valuation problem in real time. Something more akin to the analytics and display tracking mechanisms we had build at FeedBurner, Google Analytics, and many other projects. Something where you could push a button at any time and get numbers for the meeting that is going to happen in 30 minutes.
To date, we’ve been working with a number of beta partners to figure out how this data can be leveraged in sponsorship negotiations.
We’ve had teams use this data to negotiate front of jersey sponsorships in soccer, and negotiate higher renewals for in stadium signage. We’ve had brands use this valuation data to track ROI of campaigns and in stadium sponsorship across sports. We’ve seen agencies who manage relationships between the rights holders and the brands license our data to paint a better picture for their clients, and make more informed decisions about strategy, again with the press of a button.
We will have more to say about valuation later in the week, but for now, licensed users will start to see valuation numbers permeate throughout the product.
 |
| Valuation post by post |
From partner rollups (see top image), to individual post cards, to shareable video post views, to channel and sponsor drilldowns (pictured below).
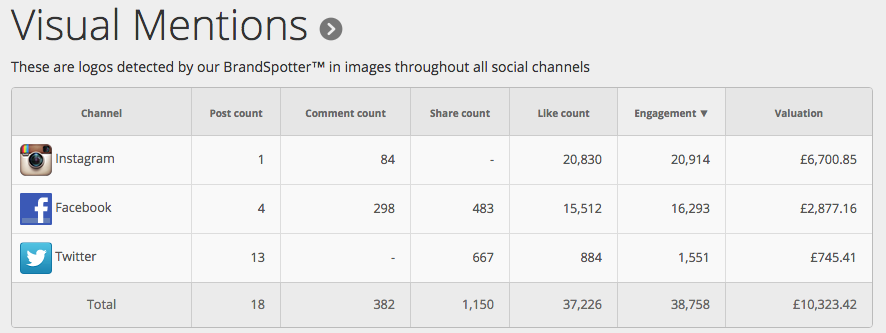 |
| Valuation by social media channel drilldown |
Please stay tuned as we talk more about how we are valuing media, the different parts of the product that can be tailored for your specific sport or geographic market, and of course how you can use Blinkfire Analytics to optimize your spend or make more money on sponsorship assets.
But we know you can’t wait. Contact us!
No Comment