You wanted events. You got events!

One of our most requested features has been to apply our technology of image and video brand detection analytics directly to a specific event, race, or game. You asked for it, you got it! Did we steal that? Never mind, you are too young to remember.
So, yes, although you can always use our real time system to generate reports for a specific time period in the past (we’re still working on generating them for the future) – what if you wanted to track specific events that have their own social Twitter and Instagram accounts?
Or, what if you wanted to put a specific geofence around an area of your event and track all the tagged posts from all companies or fans that happen in that area during that time?

What if you have some specific social media searches (say, on a certain hashtag) where you think a picture of your brand might show up and you want to track the exposure from fan posts?

All now supported. Let’s look further at this event we’ve been using so far in this post.
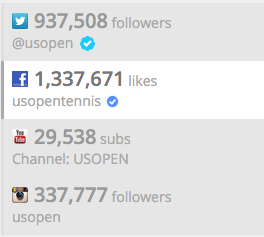
So, as you may have deduced, we tracked the US Open Tennis event in Flushing Meadows, NY. From that, we were able to generate some pretty interesting insights in both how fans interact in and around the venue, and how sponsors get exposures.
First, one of the things we saw was that fans tend to use official hashtags at the beginning of events, but they tail off toward the end. This “hashtag” fatigue isn’t something we see during a one day event, but it’s not unexpected for two week long event.

As the event gets more interesting, and leads up to the final – it’s the post from the event’s and player’s official handles that get the most engagement.
This is not really a surprise, but the fans inside the event itself (and have location services turned on) is dwarfed by the number outside who are following the event.
 |
| Engagement from “checked-in” users |
The sponsor sign placement that got the most earned media value in social, was on the wall behind the players, as most photographers took pictures head on.
There were also a number of sponsors who did a great job of getting their athletes to put their brand front and center. Check out this post by Novak Djokovic and his Head bag, placed strategically where the camera could pick it up front and center.
These are just some of the insights that can be gained from monitoring brand earned media value during and event. And of course, video is supported too.
In addition to these new visual valuation reports (that really rock, IMHO) you can still browse and discover content, consistent with how it works in the rest of Blinkfire Analytics.

As with all of our reports, export to PDF and Excel is supported for ease of sharing within your organization.

Events are available as an add on to an existing Semi-Pro or Pro subscription level, and are priced according to duration and size of event. Please contact us for more details.
No Comment