
Introducing Blinkfire’s Automatic Insights
One of the best parts about Blinkfire is the large amounts of data we have in our platform. And, we’re constantly thinking of new ways to showcase our data. We want teams, leagues, brands, and influencers to have the easiest and most efficient way to make informed, data-driven decisions.
A pile of numbers doesn’t necessarily provide value, but insights do. With that in mind, we are proud to introduce Blinkfire’s Automatic Insights. Great insights, with context and storytelling, can prompt important changes to help organizations grow, evolve, and succeed.
Automatic Insights
Customer feedback is key. Many of Blinkfire’s products and new features started from a simple customer recommendation or pain point. That’s how Automatic Insights was born. We married our love of data visualization with customer questions about their content and sponsorship performance. There had to be better way to provide valuable insights. And, we found it!
With Automatic Insights, users see which content performed better, and unlock outliers in partnership earned media value. Insights reports are delivered automatically based on the selected timeframe (weekly or monthly). Now, let’s take a look at what’s included.
Over & underperforming brands
We like to find outliers in data. It tends to make us dig a little deeper and ask the “why”.
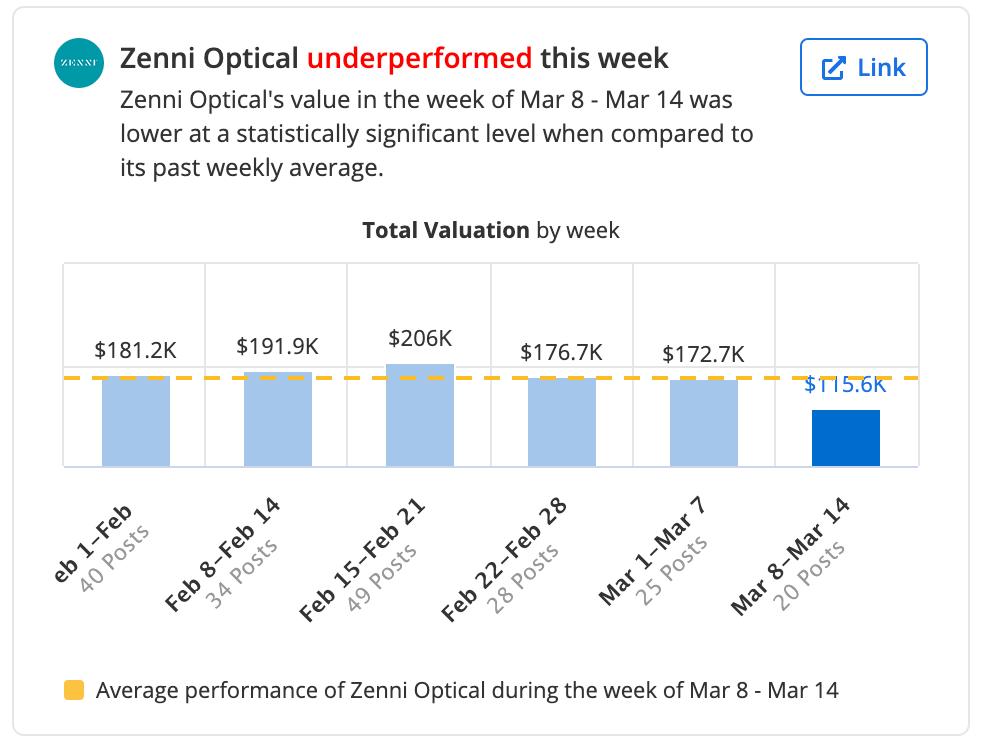
Over and underperforming brand insights show the brands where the earned media value deviated significantly from the mean compared to past performances. Did a brand underperform versus other weeks and why? Was a brand on more content than normal and received a higher earned media value? These questions can be answered using this report.
Here’s an example of the Brand Value Insights for the Chicago Bulls. This weekly report looks at data from March 8 – 14, 2021. Zenni, the Bulls’ jersey patch partner, saw its earned media value underperform compared to the five weeks prior. This insight widget also links directly to the posts. From there, Zenni’s earned media value is broken down by platform as well as per post.
Post with higher (or lower) than normal engagement & impressions
Reporting on posts with the highest (or lowest) engagement and impressions can seem routine. Typically, Instagram is the social media network where the most engaging posts live, while Twitter often has the lowest engagement due to the sheer output of tweets.
However, this insight is built differently. It highlights content performance on a relative basis. This means the top three posts returned deviated the most from its channel’s mean. Keep in mind that this insight will not always return the posts with the highest engagement or impressions. (Note: impressions data is private, and only viewable to the owned and operated entities.)
The top three posts from the Chicago Bulls with higher than normal engagement were from Twitter, Sina Weibo, and Facebook. For added context, from March 8-14, 2021, the top three Bulls posts with the highest overall engagement came from Instagram. This insight, however, highlights performance oddities. The Bulls earned higher than normal engagement from three of their lesser engaging channels.
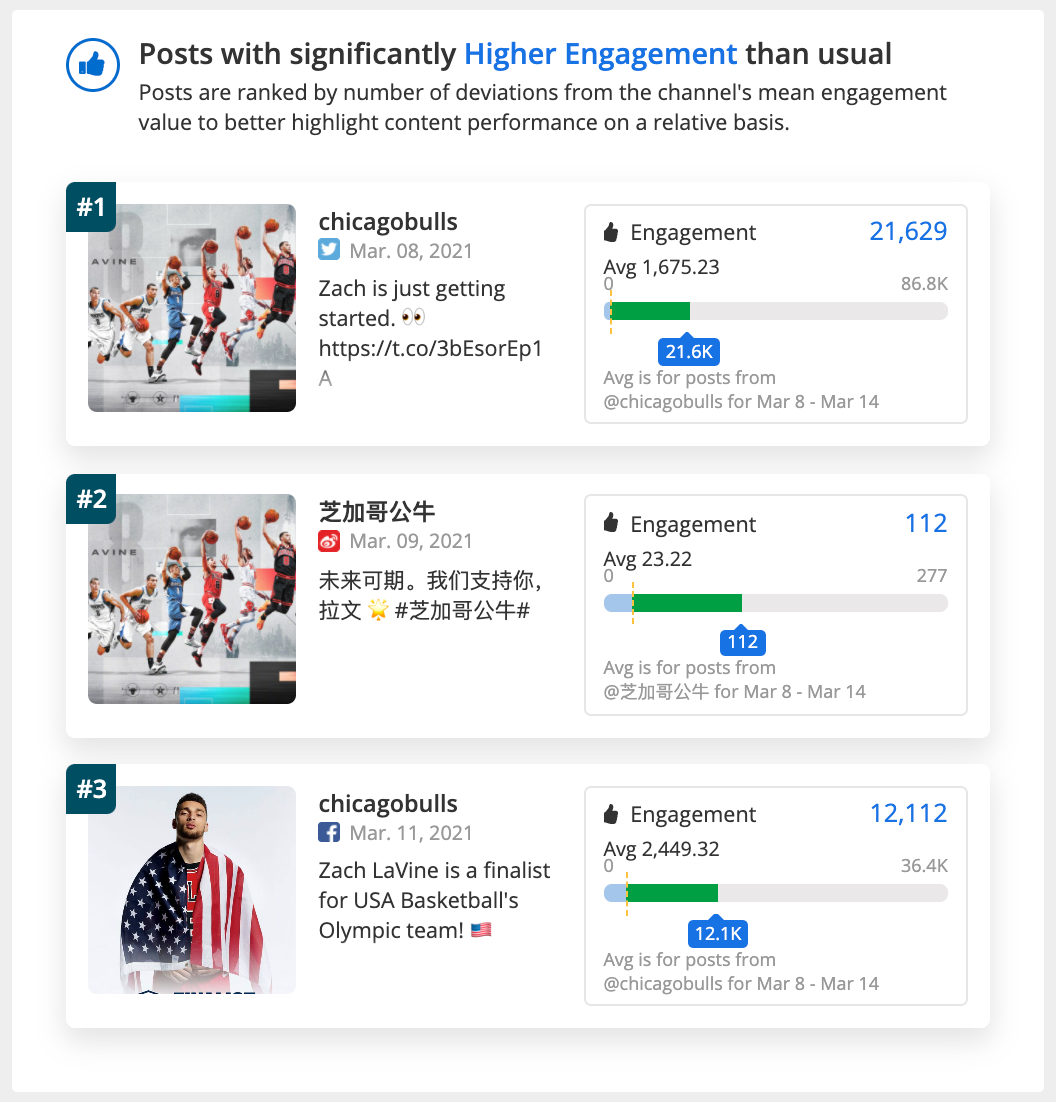
This information could lead the Bulls’ social media team to realize why these posts performed better than normal: Could there be a future content series only posted on a specific social platform? Do posts showcasing certain players earn more engagement? These are questions that might come up when reviewing this insight.
Earned media value – the post driving the most value for an official partner
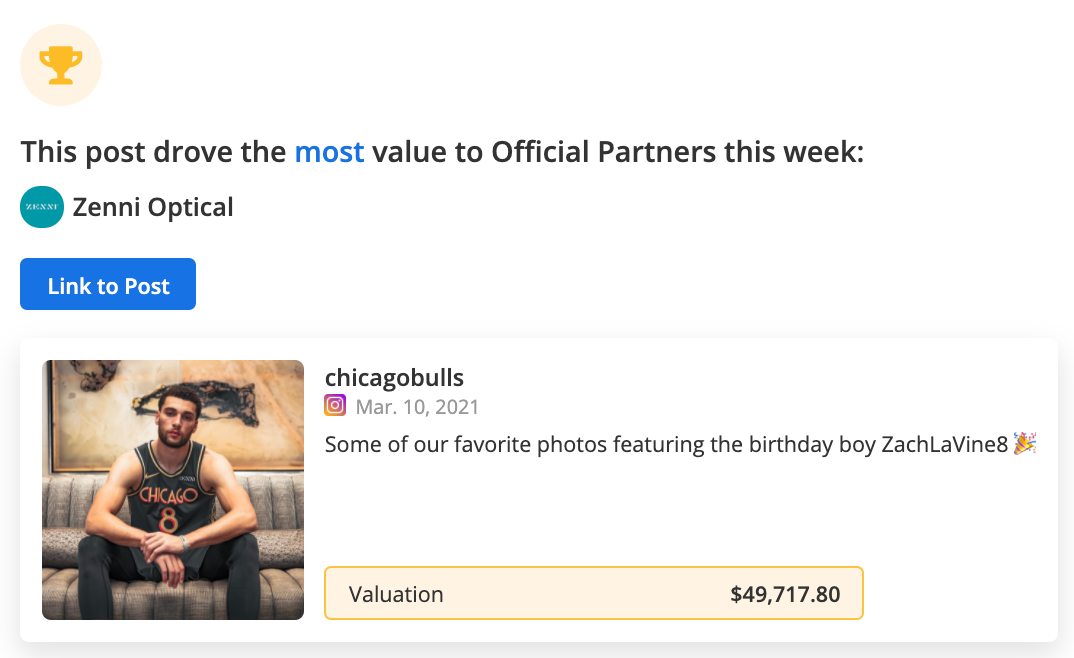
This insight shows the post with the largest media value for an official brand partner. When a team is in season, it’s a nice data point when reviewing content (whether it’s the past week or month). Did a video go viral and the naming rights partner receive added exposure? Win a big game in over time and an in-stadium asset was picked up? There’s a number of reasons why an official partner received added value. We help surface it.
This Bulls’ Instagram post earned Zenni the most value of all posts published from March 8 – 14, 2021. Also, the post can be shared within the organization or directly with Zenni. Win-win.
We hope our Automatic Insights offers teams a new and different look at their social media content and performance. As new insights are created, we’ll keep our customers and readers updated.
Looking to learn more about Blinkfire? Get in touch with us today!


No Comment