
Daily Engagement Report
Say hello to our newest platform update: daily engagement report. This reporting feature was requested by some of our customers, so we got to work on the best way to present this data.
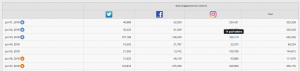
Using a customizable date range, view total daily engagement per social channel on game days versus non-game days, weekends versus week days. We also tag whether a game is home or away (orange dot = home; blue dot = away) — so teams receive a snapshot of how their content is performing.
Some of the cool features we love
Hover over a specific game day to see who a team played and the score.

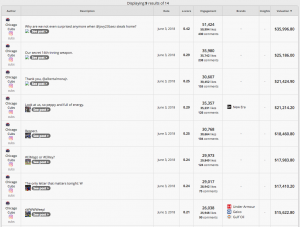
View each social channel’s engagement numbers to see how many times a team posted on that channel. The Chicago Cubs posted on Instagram 14 times on June 3, 2018 during their away game win versus the Mets. You can also click on the engagement numbers. For example, by clicking on June 3’s Instagram engagement number of 398,518, you can see a list view of the posts the Chicago Cubs published that day that drove engagement.![]()
Daily Engagement is a great supplement to our Game Day Report — which shows the engagement generated on game days and non-game days for a team’s sponsors. The ability to see two different engagement reports — total daily engagement as well as daily engagement by sponsors — will be extremely valuable as teams analyze social performance, optimize content creation, and report KPIs to sponsors.


No Comment