
Three Social Media Metrics Teams Can’t Ignore
With social media algorithms shifting away from standard follower feeds and moving toward pure interest-based discovery, the old analytics playbook no longer cuts it. Today, a million views on a viral video mean very little if that audience instantly scrolls away without engaging further. To help your organization build a truly loyal digital fanbase, we are breaking down three critical, under-the-radar social media metrics that sports teams can’t afford to ignore this year to measure true fan conversion, non-game day cultural relevance, and platform-specific demographic shifts.
TikTok Follows Per Post
Views tell you how many people saw a post. Followers tell you how many people wanted to stick around.
As TikTok continues to push content to users who don’t already follow your team, follower growth at the post level is becoming a much more valuable metric to track. Blinkfire’s private TikTok metrics allow teams to see deeper into their content strategy. While total follower growth is still important, the “TikTok Follows Per Post” metric helps identify which content is actually converting viewers into fans.
In the example below, two posts generated nearly the same number of impressions. On the surface, you’d probably call them equally successful. But one drove almost 10x more followers than the other.
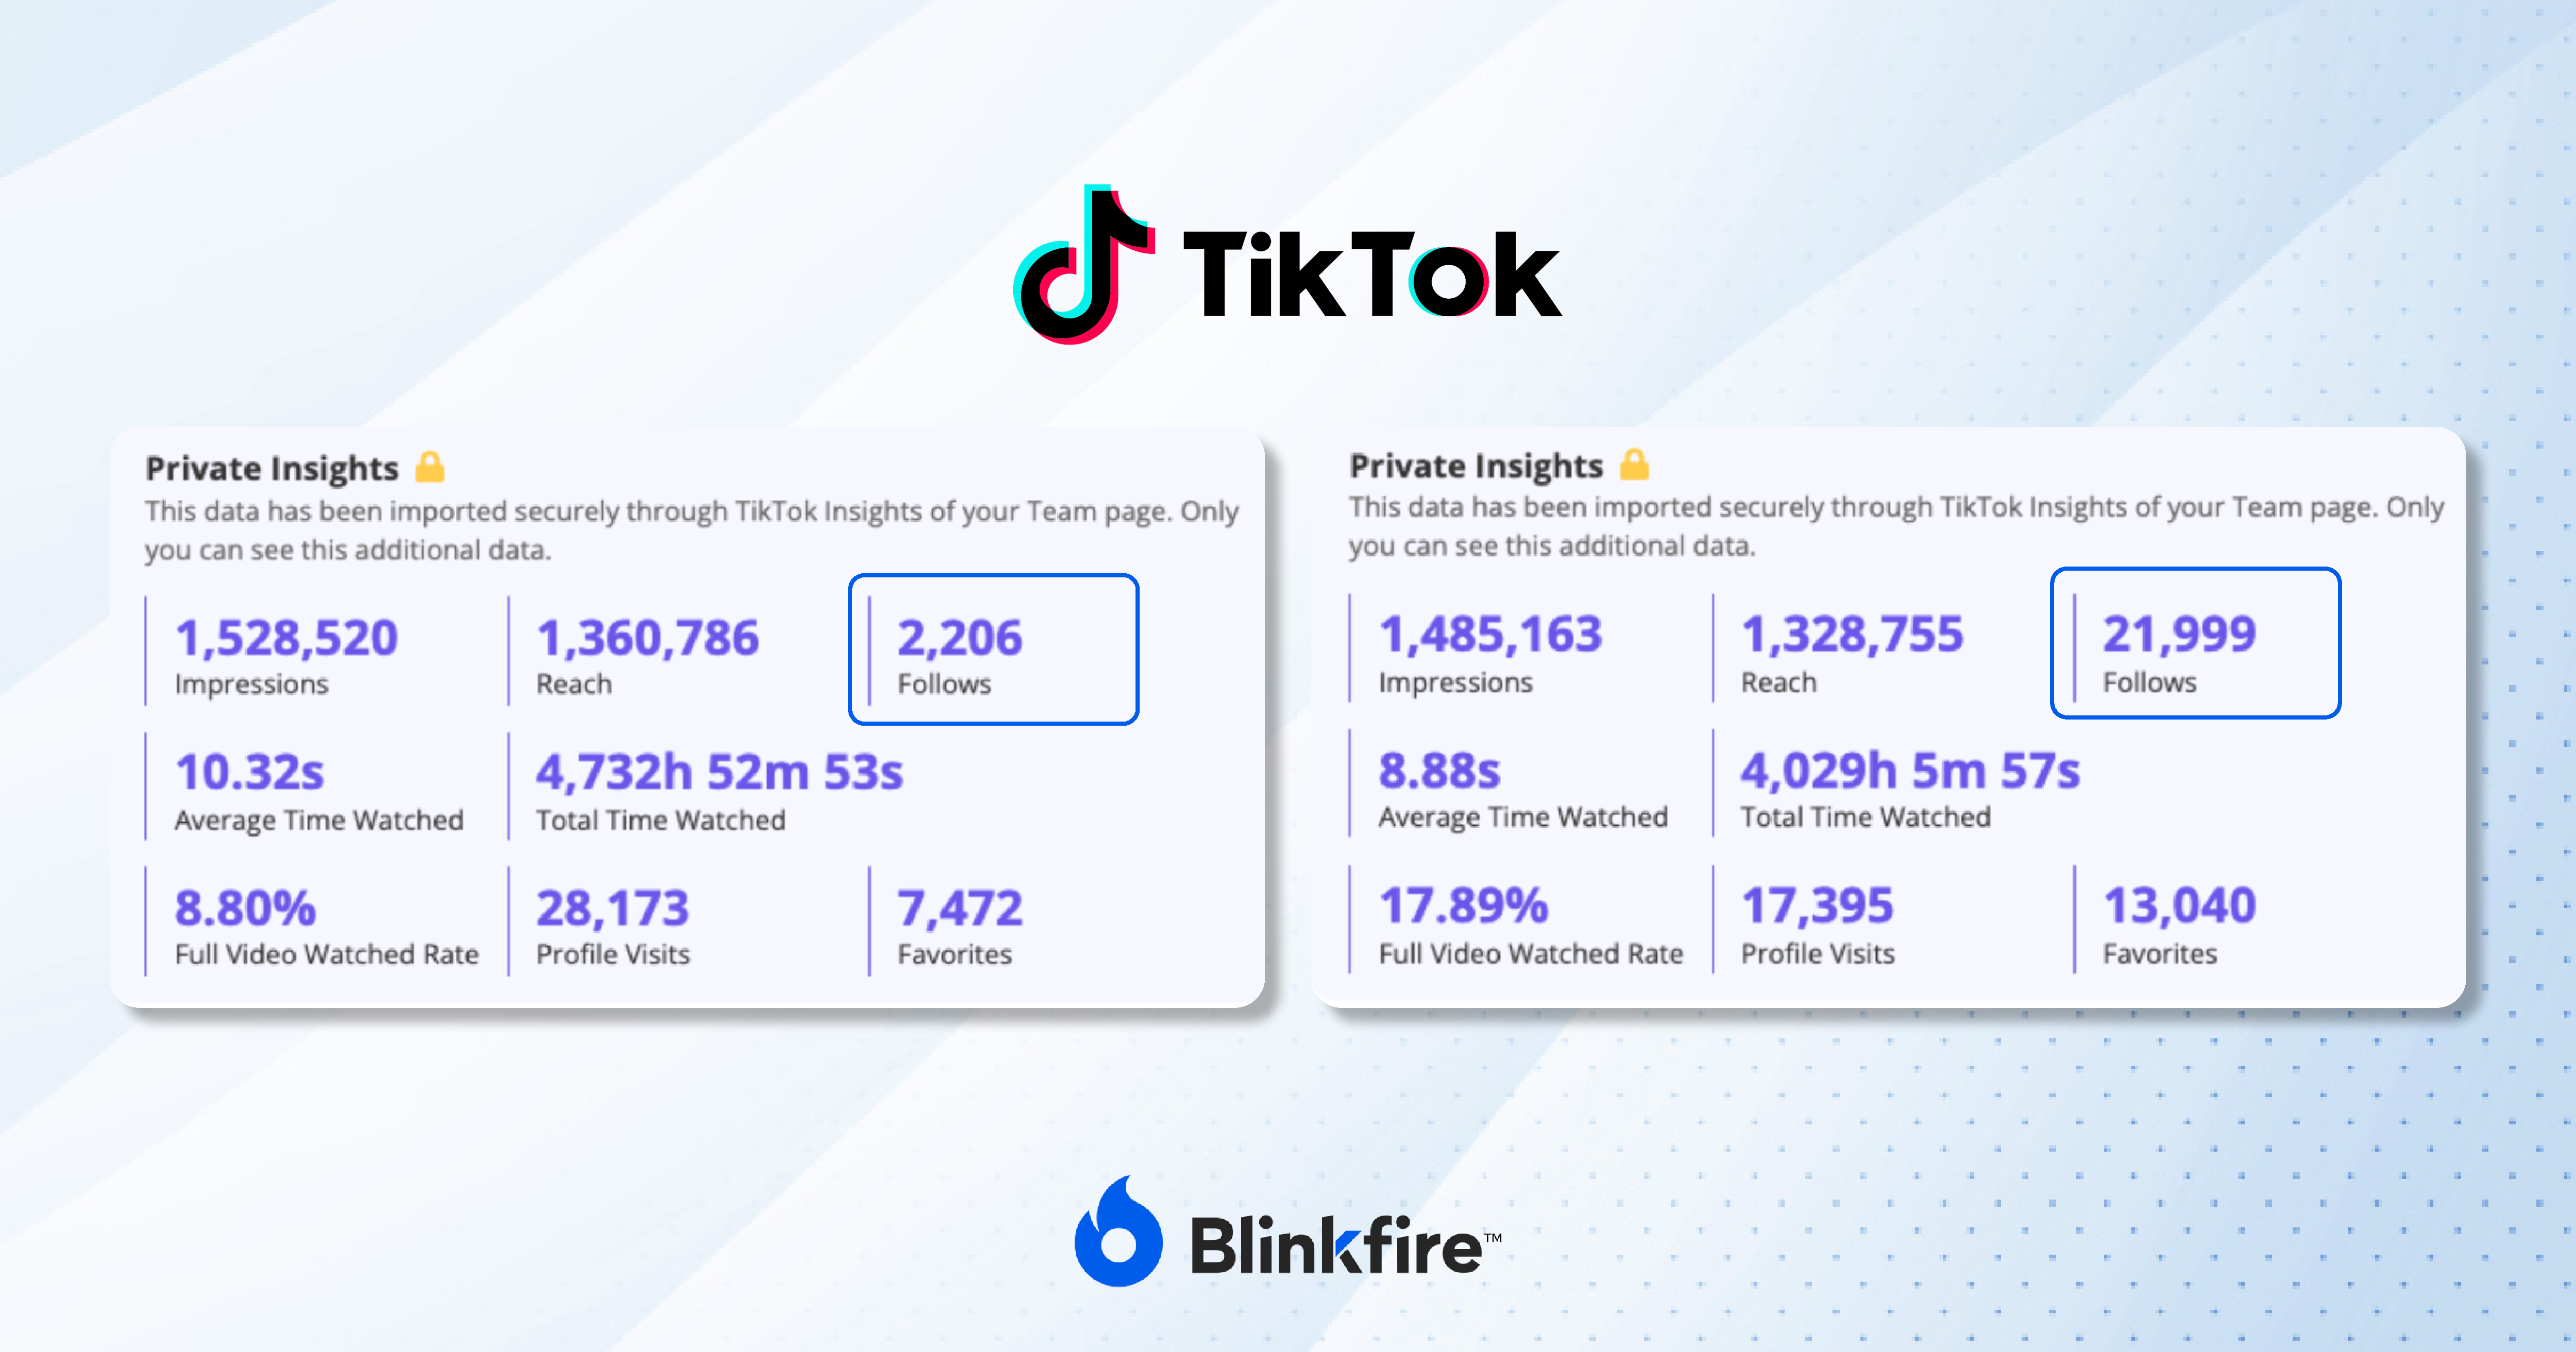
The biggest difference was the content itself. The stronger-performing post featured one of the team’s star players, giving viewers a reason to follow the account after watching. That’s why this metric matters. Reach can help grow awareness, but follows help grow your audience. Tracking “TikTok Follows Per Post” can help teams better understand which players, content formats, and storylines are most effective at turning views into long-term growth.
Game Day vs. Non-Game Day Engagement
Every team sees engagement spikes on game days. That’s expected. What’s more interesting is what happens when there isn’t a game on the schedule.

Looking at this split can reveal a lot about a team’s content strategy. Blinkfire’s “Match Day vs Non-Match Day” report gives you the detailed breakdown. If engagement remains relatively strong across non-game days, it’s usually a good indication that content like player features, behind-the-scenes moments, community initiatives, and other storytelling efforts are resonating with fans.
It’s also a useful way to benchmark performance over time. Every team has game days. The teams that consistently stand out are often the ones that find ways to stay relevant on the days in between.
Viewership Demographics Per Platform
Once you’ve figured out what’s driving follower growth, the next step is understanding who’s actually watching.
A lot of teams think about their audience as one group, but that’s rarely the case. The fans watching your content on TikTok can look completely different from the ones watching on Facebook or YouTube.
Looking at the same team across three platforms, you can see that the gender breakdown varies quite a bit. That’s important because it means the same piece of content can reach very different audiences depending on where it’s posted.

This is useful for more than just content strategy. It can help inform sponsorship activations, platform-specific campaigns, and reporting conversations with partners. It’s also worth remembering that audiences can vary at the post level too. A highlight, a player feature, and a community post might all attract different groups of fans. The better you understand who’s watching, the better you can understand what’s actually working.
Track and Value Your Content with Blinkfire
Unlock the power of Blinkfire’s AI and computer vision products with real-time analytics to monitor and assess sponsorships across social media, digital platforms, Advanced TV, and broadcasts. Explore how Blinkfire can enhance your sponsorship strategies and drive success!

No Comment