
What’s New at Blinkfire Analytics: Redesigned Sponsorship View & Promoted Post Metrics
As summer’s been heating up — with temperatures hitting the triple digits in Chicago this past weekend — so has the Blinkfire team. We’ve rolled out a few enhancements the last couple of weeks, and, as always, customer feedback was key!
Let’s take a look.
Sponsorship Report – Brand Interactions: Snapshot view of important brand data points
We know how busy different teams’ departments can be — especially during the season. So, we made life a whole lot easier by surfacing the below insights on Sponsorship‘s Brand Interaction Page. A quick screenshot grab, and you’re good for any presentation or to send over to a brand manager.
Automatically uncover important data for specific brands. In this case, we’re using the the Chicago Fire’s front of jersey partner Motorola as an example, and showing the interactions the brand earned through the team’s owned and operated channels.
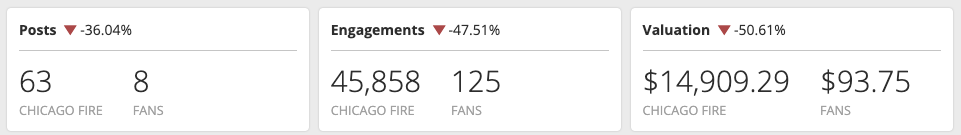
We display the number of posts and engagements plus the value (based on the CPEs, CPMs, and CPVs set per platform) for Motorola during the time frame selected. Additionally, we compare the metrics to the previous time period. This is an excellent way to quickly identify, highlight, and consistently deliver periods of strength for brands, while also proactively addressing slower time periods!
Assets & Scenes, Oh My!
Want to know what percent of time your front of jersey partner or naming rights partner appeared in a step and repeat and how that contributed to the brand’s total valuation? What about the type of scene — birthday post or score graphic? We’ve got you covered. Asset and scene breakdown is available for the team’s owned and operated tab in Sponsorship.

In looking at Motorola (the Fire’s front of jersey partner), it’s no surprise that the uniform was the brand’s #1 asset.
Value Over Time
Not only do we show the current time periods’ valuation over time, but you have the ability to compare the previous time period as well (identified by the grey dotted lines). This offers a way to visualize the ebbs and flows of brand exposure.

But wait, there’s more!
Twitter and Instagram Promoted Post Metrics
Organic post metrics are only one piece of the pie when reporting to a brand. Most teams will boost or promote content to reach new audiences and eyeballs. As this has become more important for our customers, we got to work unveiling those metrics.
Just as we show Facebook promoted post metrics on the post level and via export, we’re now happy to include Twitter and Instagram promoted post metrics.
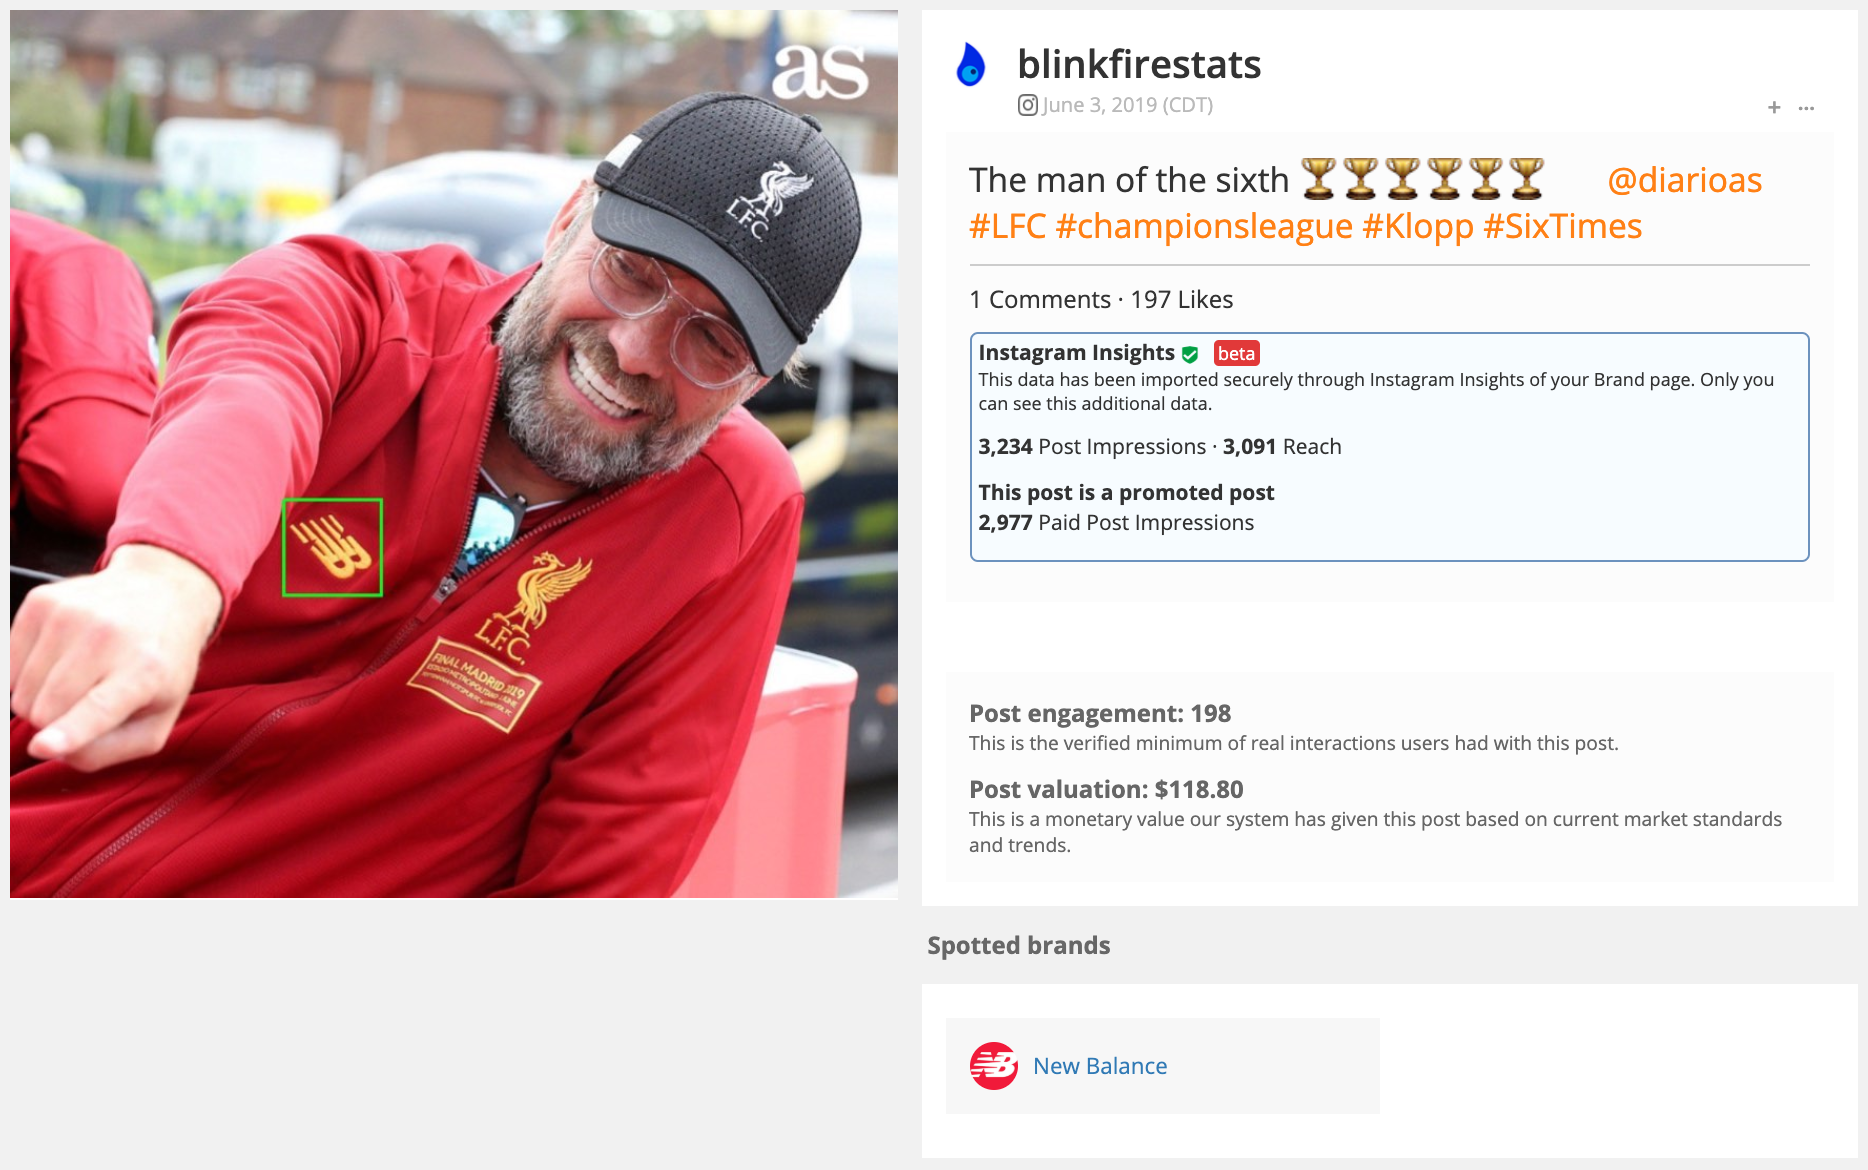
Including paid metrics when reporting to brand partners will help teams continue to tell the whole social and digital story and better equip them with the tools necessary to create better content, partnerships, and revenue opportunities.
We’re super excited about the recent work. Stay tuned as we bring more great features to Blinkfire Analytics.


No Comment