
What’s New at Blinkfire Analytics: Part Deux – Live Streaming & VOD for YouTube & Twitch
Just a few days ago, we updated you on how we’re now more accurately measuring video on OTT platforms and the web by integrating with Google Analytics, Adobe, Ooyala, and Brightcove. For Part Deux, we tried to get Charlie Sheen, but he was just way too busy riding the tiger.
Luckily, we have something way more interesting to tell you. Today, we’re excited to announce that live streaming and video on demand (VOD) stats for YouTube and live streaming stats for Twitch are now available on Blinkfire Analytics.
Let’s watch the real thing LIVE
Since we’ve been measuring both live streams and VODs on the same content – we’ve been able to derive a number of interesting insights that we’re going to share with you, our fine readers, right meow.
Especially with these long form videos, what we’re seeing is that fans prefer watching sports and esports in real-time. When comparing the same pieces of content posted to social and OTT platforms, the live content is consumed far more often than VOD.
For example, during LaLiga 1-2-3 matches, we’ve seen a 6x increase in live minutes watched compared to VOD. With esports content, that increases to more than 11x live minutes watched compared to VOD.
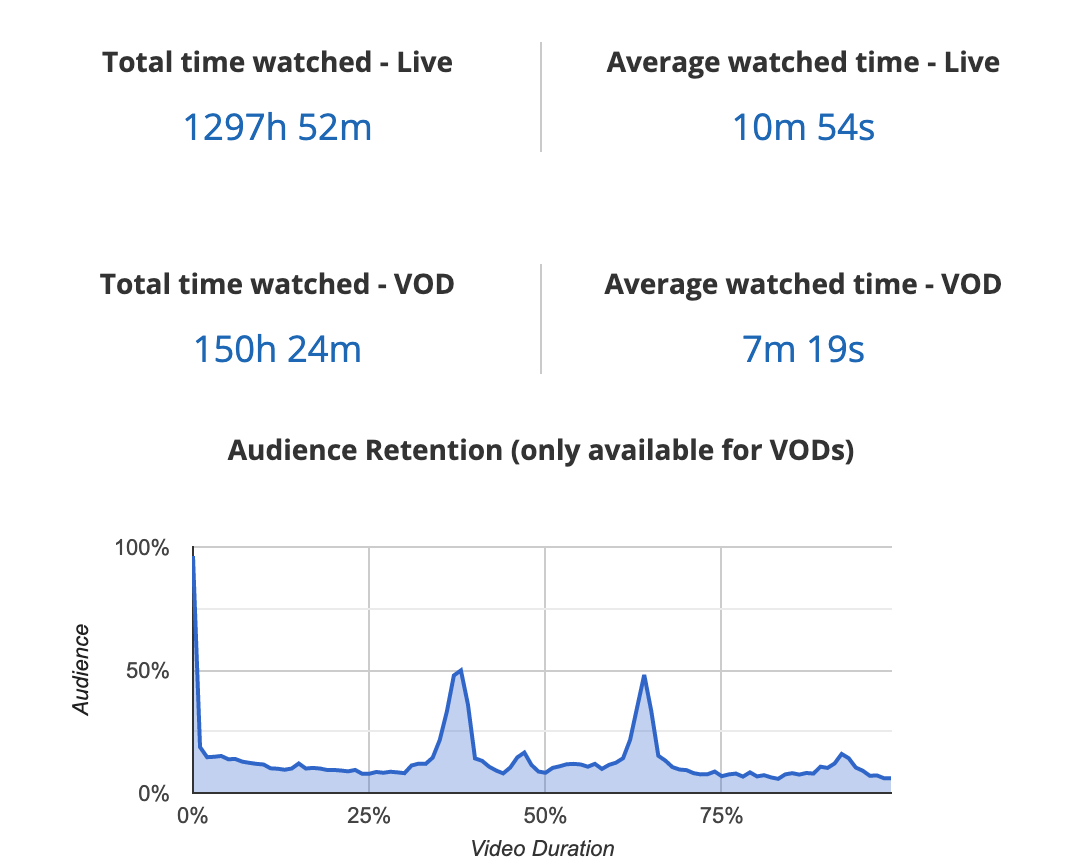
Since VOD provides viewers the freedom to skip ahead to a specific goal in soccer or a “big kill” in esports, VOD audience retention can differ greatly than live audience retention. VOD viewership often drops off in the very beginning of a video, as users jump ahead to the content they want to watch. In the graph below, YouTube’s VOD viewership peaked around the one-third and two-third marks of the video. You’ll also notice the huge difference in total live time watched compared to total VOD time watched.
YouTube
On the flip side, the Twitch live retention graph below shows viewership is steady throughout the duration of a live stream (in fact, viewers pick up toward the end), whereas VOD viewership tends to have numerous ebbs and flows (users fast-forwarding ahead or dropping off at specific points).
Twitch

This video retention data is extremely valuable and powerful for organizations. Not only can teams better understand the types and length of content their fans best connect with, but they can also layer in the brand exposure and brand valuation pieces. Knowing your audience is more likely to watch content ranging from two to three minutes in length, allows different departments — from social media and content to partnerships — to work together to produce the most engaging content that also gives brand partners the greatest opportunity for exposure.
In part three – we will talk about how this allows us to value sponsor exposure much more accurately. Be prepared, it may involve calculus.

No Comment