Scene Value Report: The Best Way to Track Content Series
Scene value report; the best way to track content series
As you scroll through your timeline feed double tapping a Lakers’ score graphic, FIFA Man of the Match, or a birthday post celebrating a team’s player, those in #smsports know the method behind the madness on how this content and brand partnerships come to fruition. It’s not by accident that Dunkin’ sponsors a birthday post or that Athletico sponsors an Injury Report.
Organizations, individuals, and brands are constantly monitoring and adjusting content in order to maximize performance. However, there is so much more detail available outside the normal engagement and follower metrics. One of those detailed data sets are content series better known as scenes in Blinkfire.
What is a Blinkfire scene?
Scenes are specific pieces of social media content like a birthday post, line up graphic, or game preview. Blinkfire’s BrandSpotter™ technology tracks more than 50 scenes across traditional sports and esports. Most rights holders create scenes that they use throughout a season, and those scenes drive value and engagement for brand partners by active or passive exposure. Blinkfire’s Scene Value Report helps track and value those scenes, so you don’t leave potential profits on the table.
We made big updates to our already popular Scene Value Report to give users even more customizable data! We added multi-entity comparisons, updated scene performance metrics, and refreshed the look and feel of the report to create a cleaner, more visually accessible report. Keep reading for a more detailed view on how our Scene Value Report works and how it can help your organization.
Scene Value Report Upgrades
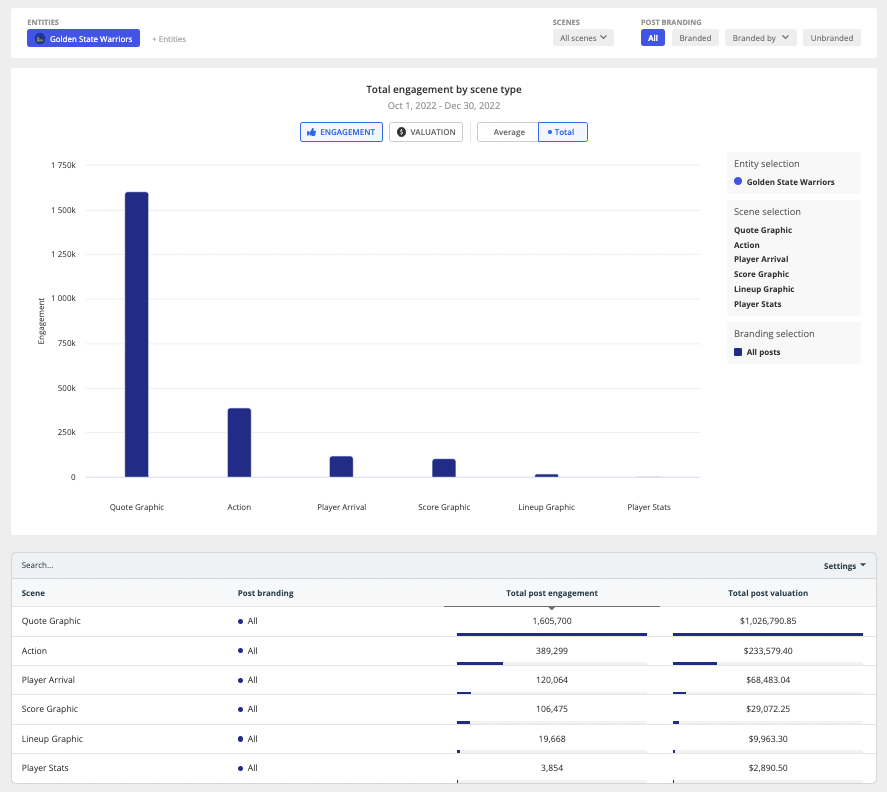
In our Scene Value Report, users can select post data on all posts, branded posts, or unbranded posts. Users can also select all scenes to see overall scene performance based on total or average engagement or valuation. Specific scenes can be selected such as score graphic, action, or goal celebration for a more detailed look at insights. Check out this Scene Value Report example from the Golden State Warriors showing their total engagement by scene type in Q4 of 2022.
Compare Scenes from Multiple Teams
NEW to Blinkfire’s Scene Value Report is our multi-entity and entity group options. For example, users can choose other teams in their sport or city or teams based on market size to compare scene data. This additional competitive analysis layer informs users on scenes they could incorporate to create new content series with brand partners.
Use Case: If Chelsea FC wanted to view scene performance against other teams in the Premier League like Manchester City and Arsenal FC, they could use Scene Value Report. This could help partnerships with selling to sponsors as well as social media with content creation.

Branded vs Unbranded Scenes
Detailed data that compares branded and unbranded scenes is available in the third section of the report. This includes post count, total engagement, and branding score. These comparisons can show where teams may have opportunities for more sponsored scenes. The example below from the Los Angeles Lakers shows they have valuable scenes such as player arrivals that earn engagement, but are not branded (whether from passive or active exposure). Changing photography to show brands in the tunnel as players arrive to the stadium is one option; the other — package player arrivals around a specific brand partnership. Some popular ones we see in the NBA are from GOAT, Michelob Ultra, and Tissot.

On top of all of Scene Value Report’s benefits, this report (along with all others in Blinkfire) is exportable to share internally and with partners. We want to do the heavy lifting on data to give you more time to analyze and create actionable insights.
Want to learn more about how Blinkfire can help you with social media and sponsorship reporting? Get in touch with our team today!