
New & Improved: Blinkfire’s Competitive Analysis for Social Media
Social media benchmarking is a tried and true way for organizations to compare metrics against industry standards. Those standards could be: 1) comparing their social stats versus other teams in a league; 2) analyzing stats based on other professional teams in a city or region; 3) benchmarking against other teams that have the same sponsor or similar content series. While Blinkfire’s Global Ranking is a staple in the benchmarking department for our customers, we also have our Competitive Analysis tool.
We recently updated many aspects of Competitive Analysis, making it a more powerful tool to use for deeper social media and sponsorship metrics. One of the biggest updates gives users the ability to customize their analysis by choosing several entities to compare at once. This allows for easy, fast, and seamless comparison between teams.

With Competitive Analysis’ updated look, comparable social media metrics have a modern, color-coded feel that makes trends and competitive differences easier to spot for all users.
Benchmarking Metrics
Competitive Analysis includes side-by-side comparison of basic and advanced social media metrics like followers, number of posts, engagements, and more. Here’s a more in depth look at how each comparison metric works.
Social Media Presence
Tracking social media presence includes channel and follower metrics. Increasing follower growth is a vital part of successful social media strategy.

Posting Strategy
Tracking post count and number of branded posts gives marketers a chance to compare volume to competitors. This influences social posting strategy as quality-over-quantity can be a factor.

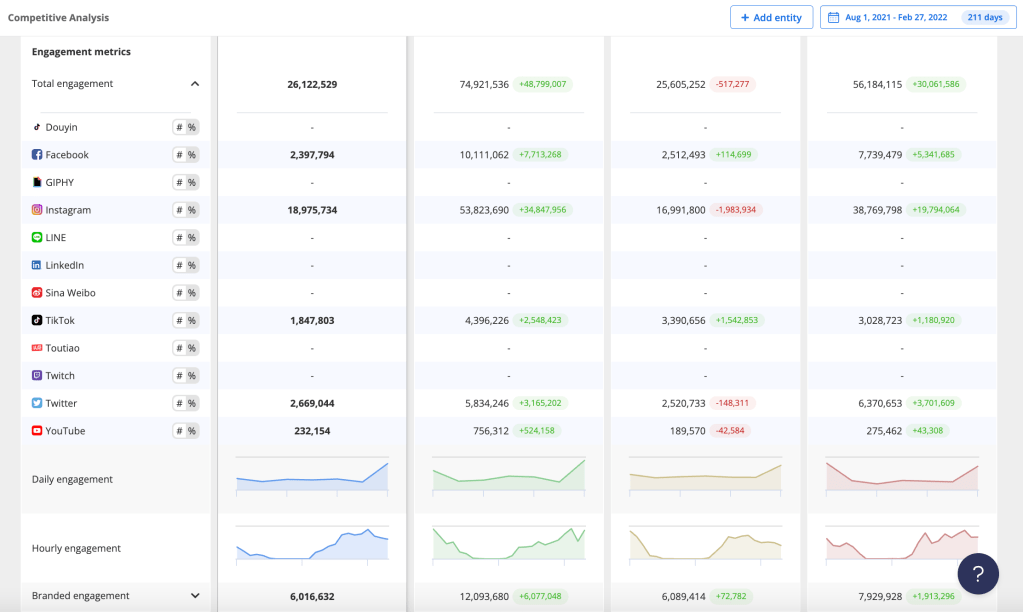
Engagement Metrics
Engagement Metrics include metrics like total, daily, and hourly engagement and engagement per follower. A team with a smaller social following than others might have a higher engagement per follower because of a strong content strategy.
Valuation Metrics
Valuation metrics include total, daily, and hourly valuation, branded valuation, and valuation per follower and per post. Tracking valuation metrics tells users not only how content is performing, but also how branded content (where a sponsor is presents) performs. This data can be integral for prospecting, selling, and renewing deals.

Average Engagement Metrics
Average engagement metrics are shown for each platform along with averages for text, image, and video posts. Tracking average engagement across these areas helps marketers see which content is performing well and which content is not or needs improvement.

How Blinkfire’s Competitive Analysis Can Help
There are numerous ways benchmarking and competitive analysis can help with social media. We’ve listed three ways you can use it to better understand how your social media strategy is performing, ways to improve it, and new ideas or trends to leverage.
Same City or Region
Comparing against other teams with a similar fan demographic, market size, or social following is another way to benchmark to understand social media performance, sponsorship, and potential growth.
Similar Market Size
Comparing against other teams with a similar fan demographic, market, or social following is another smart way to benchmark.
Aspirational/Social Media Leaders
There’s always that leader in every league; a team that wins the content or social game. And, other teams might use them for inspiration. Competitive Analysis is a smart way to understand how the best in the sports and social media business do things. When you benchmark against the top, it’s hard not to get better.
Learn more about Blinkfire Analytics’ benchmarking, social media, and sponsorship analytics.


No Comment