
3 Event Dashboards to Track Social Media & Sponsorship
On game day, everything is heightened, and as a social media or content manager, you probably have your hands full. The last thing you want to do on game day or the day after is collect data insights on social media and sponsorship performance. However, your partners and other departments in your organization want that data as soon as possible to review performance and make strategic decisions. That’s where Blinkfire comes in to help track social media and sponsorship metrics that matter most.
Whether it’s a major event like a bowl game or major championship, large tournament, or just a classic game-day, you can track social and sponsorship data using Blinkfire Dashboards. Our interactive dashboards give users the ability to build customizable snapshots of data that help you spend more time taking action during the chaos of big events.
We created three event dashboards that our most active customers build to show how these customizable dashboards can help your team tackle social and sponsorship data for events:
1. Track game day performance
It is important for teams to capitalize on game-day because you have a highly engaged audience. These days should provide peaks in performance metrics like engagement. If you’re getting more or less exposure than usual, you’re going to want to know that in real-time so you can capitalize or make adjustments. Blinkfire’s dashboards supply real-time data so your team can stay up to speed on your social and sponsorship metrics before, during, and right after game-day.
Dashboard Idea
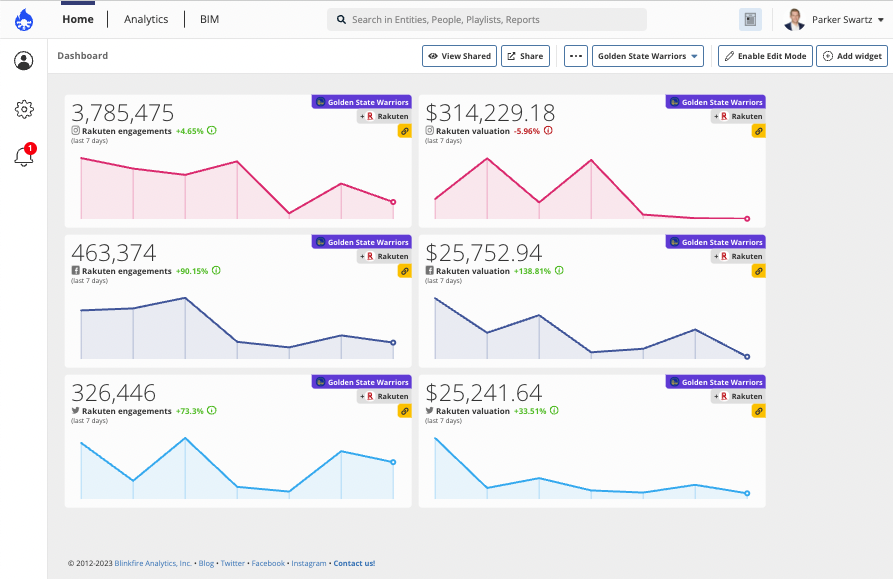
It’s game-day in the NBA and the Golden State Warriors want to track their sponsorship performance on Instagram, Facebook, and Twitter throughout the day. They could create a dashboard like this one that tracks their jersey patch sponsorship engagement and value across social networks compared to each network’s overall engagement and value. This can help give insights into how to tailor content to different social networks, where there are missing value opportunities, and more.
2. Share event sponsorship data
Brands love to sponsor events because they provide large opportunities for exposure in a short period of time. While these partnerships create value, they also require work to accurately track exposure within a short time period. Blinkfire Dashboards help partnership teams and/or brands monitor sponsorship performance and then share that data with their partners. Blinkfire’s dashboards are shareable as snapshots (point in time) or dynamic (link constantly updates data) to give partners helpful visual insights, whether they have a Blinkfire license or not!
Dashboard Idea
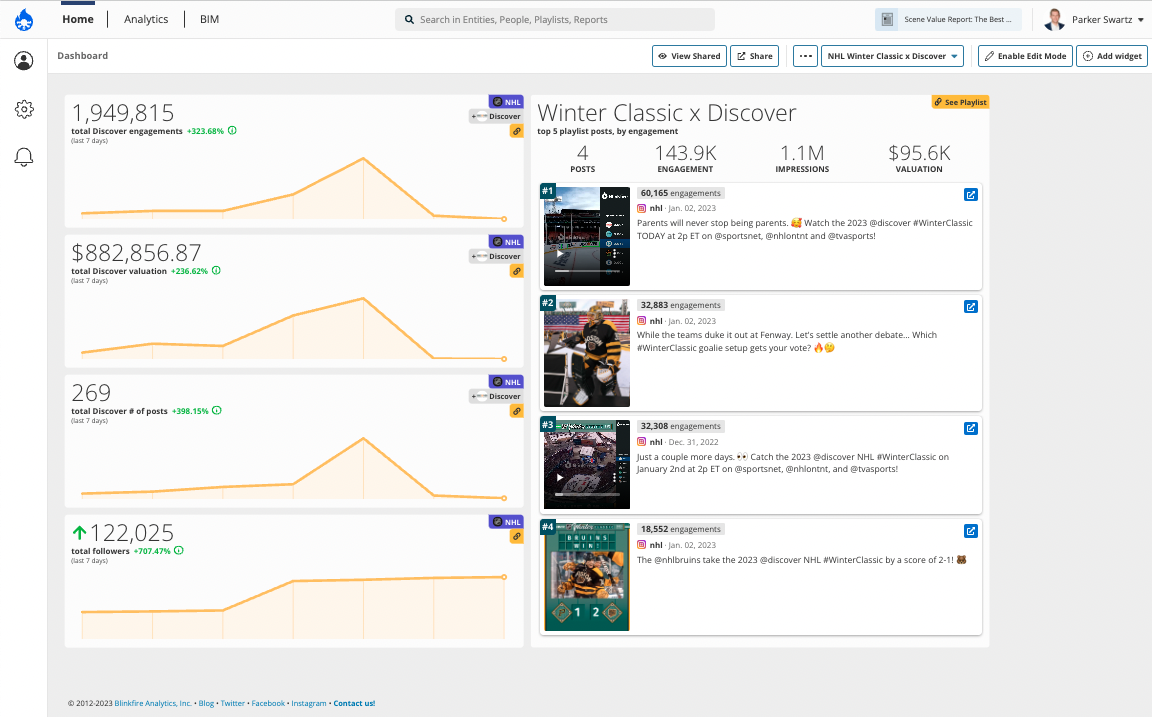
The NHL Winter Classic was held on Jan 2, 2023 between the Boston Bruins and Pittsburgh Penguins at historic Fenway Park in Boston, MA. The NHL could track their primary sponsor, Discover, using a Blinkfire dashboard like this that tracks engagement, value, post count and includes a blinkfire playlist of featured posts that you can customize. They could then send a dashboard like this to Discover to highlight the exposure that the event is creating for the brand on social media.
3. Analyze tournament data
Big tournaments create buzz. The World Cup, NCAA March Madness, The Masters, and countless other high-profile tournaments create massive social media engagement with amazing athletes on the biggest stages. There are also large sponsorship opportunities for brands with many eyeballs on the event. Blinkfire’s dashboards give users a visual view of multiple sponsorship and social data during a tournament.
Dashboard Idea
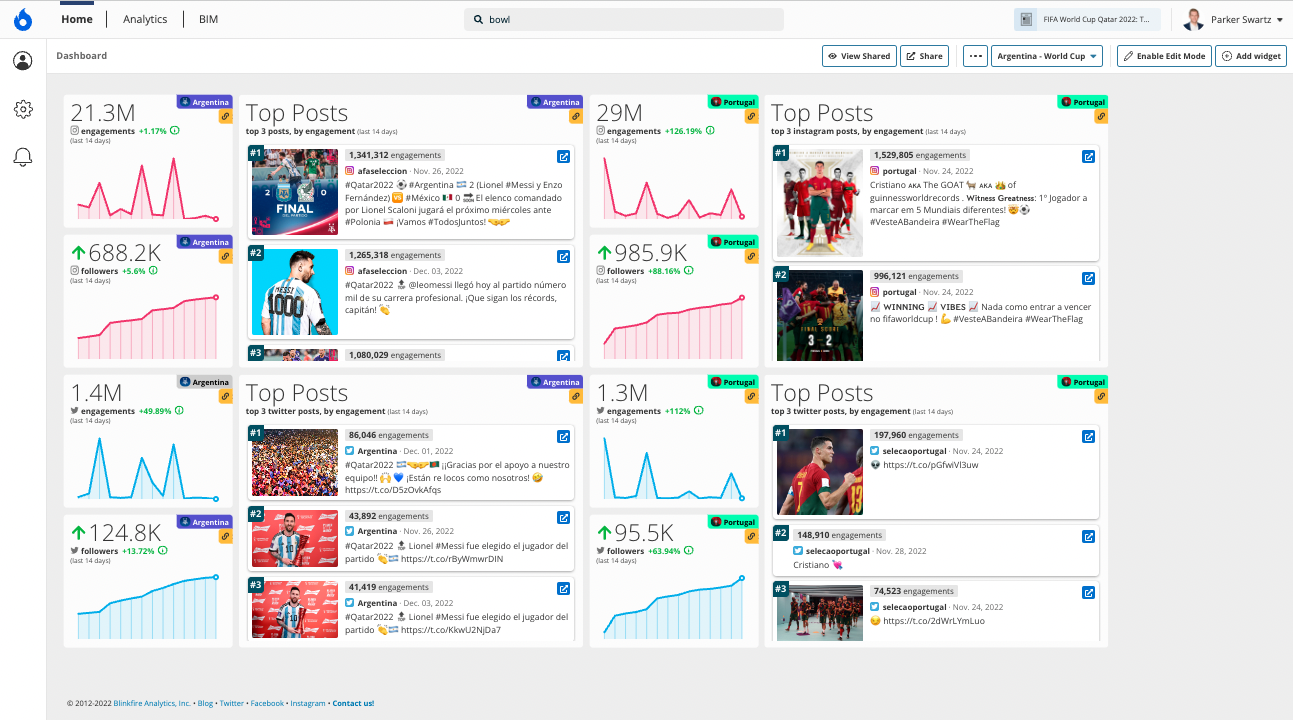
The 2022 World Cup was incredibly exciting with amazing goals, thrilling upsets, and inspiring storylines. While this is a long tournament, a team such as Argentina could track their social media performance throughout the tournament using a dashboard like this that monitors their performance across multiple social networks. Monitoring top posts, engagement and even comparing their performance against others during the tournament can produce actionable insights that can lead to increased performance.
Dashboard Idea
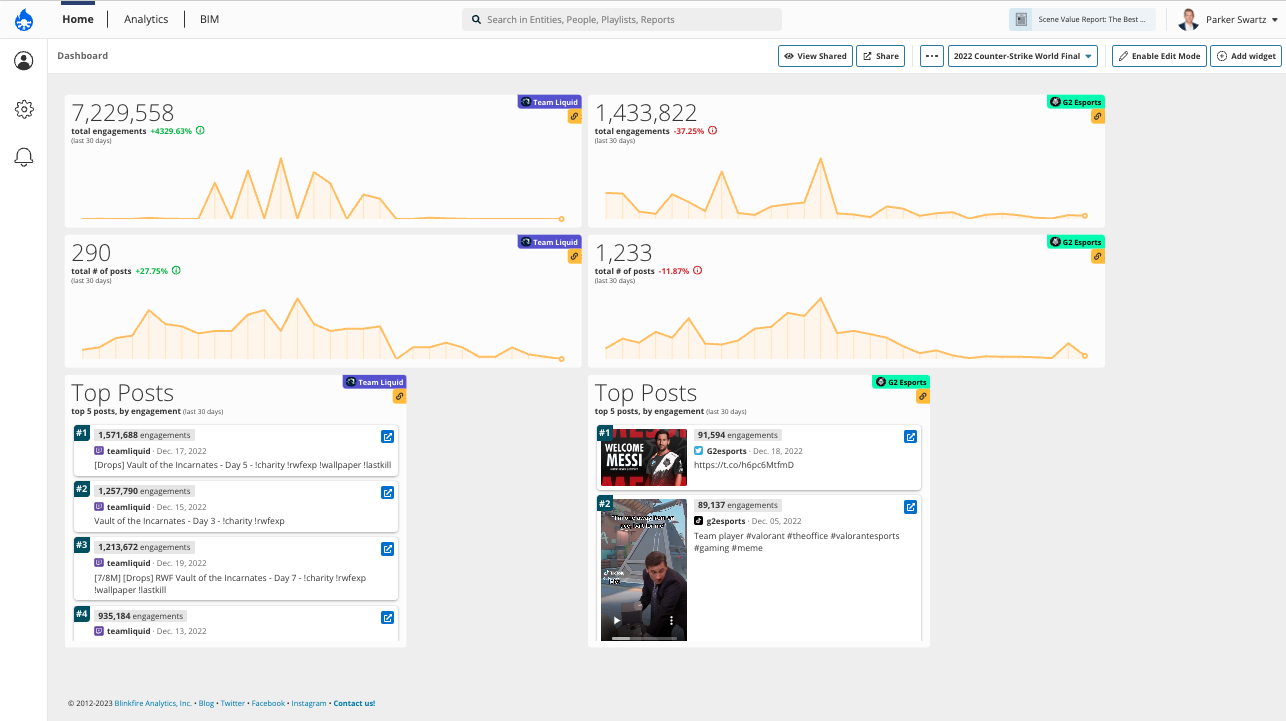
Counter-Strike is one of the most popular esports games in the world. The Blast Premier: World Final for Counter-Strike was won by G2 in December of 2022. If Team Liquid, one of the World Final contestants, wanted to track their social performance during the tournament, they could create a dashboard like this that tracks their engagement, post count, and top posts across all their social networks and compare it to another team like G2 Esports.
It’s time to make game-days, tournaments, and events easier on our content managers and partnership teams. Blinkfire’s customizable dashboards supply real-time data so you can quickly get the insights you need and share them accordingly. Beyond our dashboard tool, Blinkfire gives users all the detailed reporting tools necessary to make social media and sponsorship tasks easier.
Build a Blinkfire Dashboard Today
Interested in learning how Blinkfire can track your sponsorship and social media data for events and more with our advanced data reporting tools?

No Comment