
Blinkfire’s New and Improved Dashboard
Blinkfire customizable dashboards give organizations around the world the real-time insights they need to make data-driven decisions for social, digital, and broadcast partnership marketing. However, at Blinkfire, we never stop innovating!
We gave our dashboard tool a refresh and added new features for users. On top of a bold new look, users can now make multiple entity widgets (team, league, athletes), create different types of charts (bar, pie, line), and build new dashboards from pre-made templates. Additionally, our new timeframe controls allow users to easily toggle between different time periods of data.
Track Multiple Teams, Leagues, Players, and More
Customers can select multiple entities in a single widget to compare in real-time. Choose up to four different entities and compare data on specific brand exposure, engagement, impressions, followers, valuation, and post count. Brands with many partnerships or ownership organizations with multiple teams can easily track performance with these custom cards.
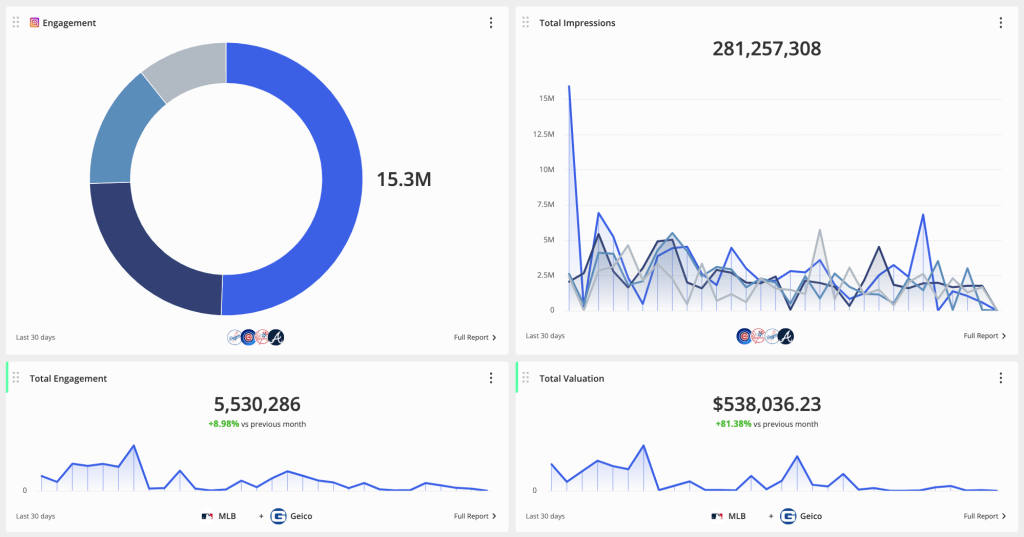
Brand Partnerships Dashboard
The dashboard below highlights the Geico’s partnership with the MLB and the exposure driven from the Chicago Cubs, Atlanta Braves, New York Yankees, and LA Dodgers.
Ownership Organization Dashboard
For organizations that own multiple properties, adding up to four entities to a widget is a great way to track performance and insights. Using our friends at Smith Sports & Entertainment, we highlighted four properties they manage: Utah Jazz, Salt Lake City Stars, Jazz Gaming, and Real Salt Lake.

Create Customized Charts and Graphs
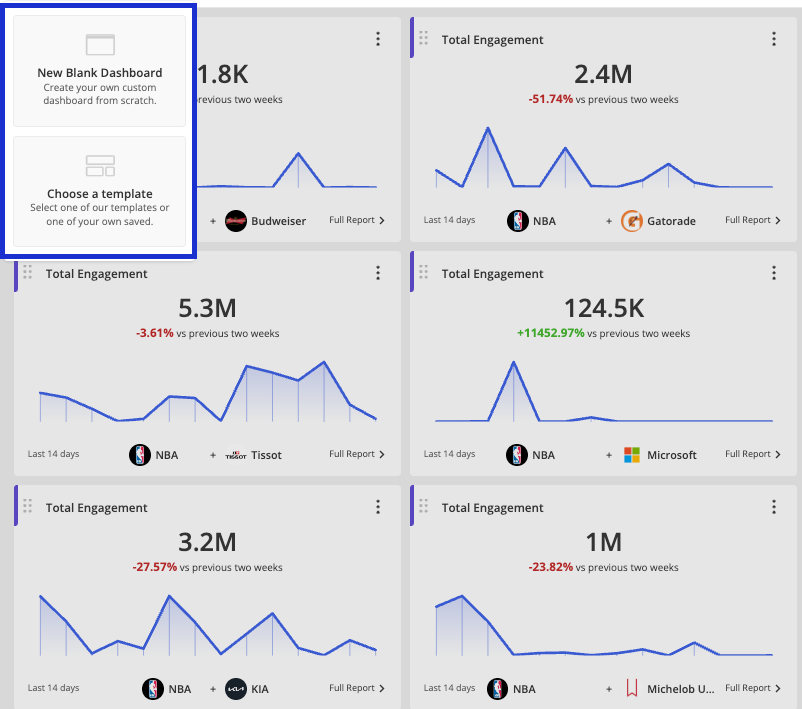
Different data calls for different visualization. With this update, choose between pie, bar, and line charts to create the best visual representation of your data. The example below shows total engagement, impressions, and followers for four top-tier market NBA Teams. Outside of charts, users can create “list” widgets from our best-in-class reporting tools like Global Ranking, Brand Leaderboard, and Blinkfire Index. The Global Ranking widget in the dashboard ranks NBA teams based on total video views.

Build Dashboards Using Templates
Don’t know where to start? We created templates that let you input the entity and/or brand you’re looking to track based on performance. Our tech does the rest and creates a customized dashboard with pre-made widgets that helps you monitor and measure your data.
Here’s how it works:
1. Decide if you want to create a blank dashboard or use one of Blinkfire’s templates. We built some pretty cool ones based on customer feedback!
2. For this exercise, we’re going to use one of Blinkfire’s prebuilt templates. Since we see a huge focus on partner reporting (a team tracking sponsors or a sponsor tracking partners) and benchmarking, we created two templates to fulfill these needs.

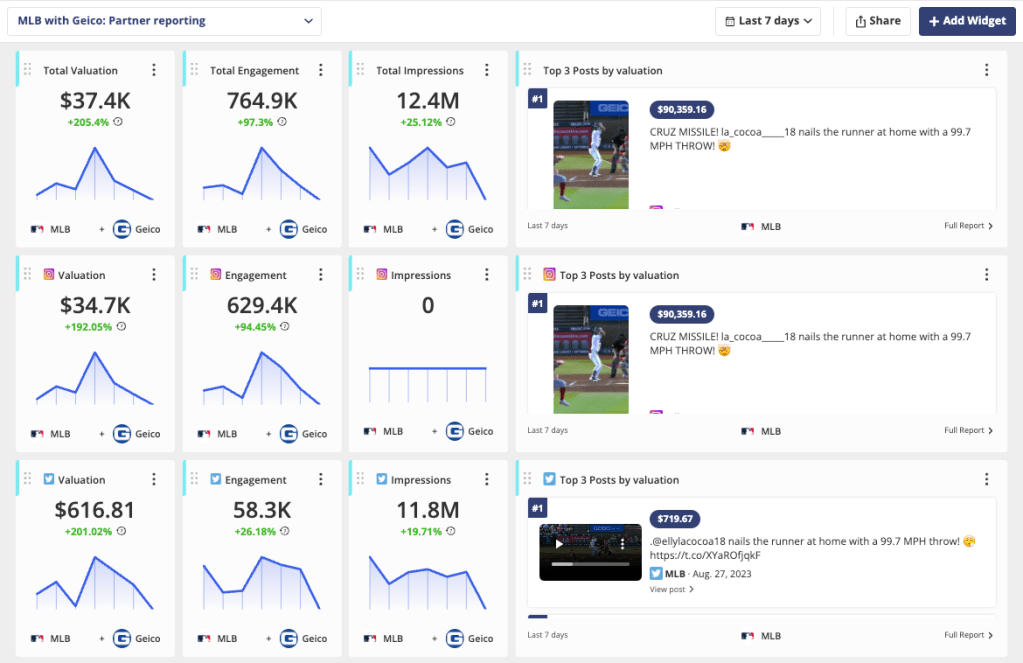
3. Using the MLB, we’re going to look at Geico’s partner performance. By selecting these two entities, Blinkfire will automatically generate a dashboard for you.

4. Partner Dashboard: In just a few clicks, we generate a dashboard that includes metrics the MLB would care about to monitor Geico’s performance. This includes: total valuation, engagements, impressions, and top posts. We also include specific social channels as well to break down Geico’s performance.
Other New Dashboard Features
More Timeframe Flexibility
Blinkfire Dashboards let users select different date ranges, but now that process is simpler than ever before with our centralized timeframe control. Customers can change data across all widgets to the last 7, 14, or 30 days. If you prefer to have multiple timeframes in your dashboard, can change each widget to show different time frames.
Share Dashboards with Anyone
Beyond sharing dashboards with your team members, you can share outside of Blinkfire. A couple of use cases we’ve seen: 1) Sharing with executives at your organization who want to see high-level dashboards on performance — whether it’s for your team’s social accounts or to review partnerships 2) Sharing with brand partners. Create brand-specific dashboards to share with your partners.
We can’t wait to see the customized Blinkfire dashboards that our world-class customers create to transform their data into interactive visuals. With multi-entity widgets, new charts, and custom templates, we’re paving the way for a new era of data-driven decision-making, empowering users to extract richer insights and drive impactful outcomes on social, partnerships, and overall marketing.
Track your data in real-time with Blinkfire Dashboards
Blinkfire empowers teams, leagues, brands, and influencers with the most accurate, real-time social media and sponsorship data powered by our patented, proprietary AI technology.
Interested in learning more about how Blinkfire can help track and value your sponsorship and social media data with advanced reporting?

No Comment