
9 Twitch Metrics to Enhance Your Streams
Esports are seldom televised, so live streaming platforms are the hub for reaching fans. One of the most popular live streaming platforms in the world is Twitch. Esports influencers, teams, and leagues look to have a strong presence on Twitch because of their and unlike traditional social media platforms, they can showcase their gameplay and tournaments live.
Blinkfire tracks multiple streaming platforms likes Huya, YouTube, and Twitch along with many other social media networks. In this blog, we show you how analyzing Twitch metrics and performance can give you insights into your streaming strategy.
To help you navigate Twitch, here are nine important Twitch metrics (with esports customer input!) to track live stream performance, build subscribers, and increase visibility.
- Average CCV
- Peak CCV
- Hours Watched
- Live Metrics
- Live Retention
- Subscriber Growth
- Best Time to Stream
- Video Views
- Valuation
1. Average CCV
What this metric is: Average concurrent viewership (CCV) is the average number of viewers in a stream. This is widely regarded as the most important metric streamers and brands should consider when looking for sponsorship opportunities.
Following a player, esports team, league, or tournament on Twitch does not mean fans will tune into every stream. While followers are important, tracking average viewership is essential to understanding how many views your videos received. Viewership is especially valuable on streaming networks because there is more attention on a live video stream compared with scrolling past at a 30-second video or image on your timeline feed.

2. Peak CCV
What this metric is: Peak Concurrent viewership (CCV) is the highest number of viewers in a stream.
Peak CCV is a great metric to compare to average CCV. While your average CCV could be low, you might see that your peak CCV is much higher. This could indicate that streams are more popular during specific moments, but losing viewership at other times. On the other hand, if the two metrics are similar, this could show continued interest from viewers over time.
How to report on Average and Peak CCV in Blinkfire
Average and Peak CCV can be found in Blinkfire’s Streaming Report for games, streams, and titles over a specific time period. This report was specifically made for esports teams and streamers to unlock the most advanced data in one customizable report.

3. Hours Watched
What this metric is: Hours watched is the total time that people watched a stream.
While some people watch streams for 15 minutes, others watch for hours. You could have the same number of viewers as another channel but very different hours watched. This is a great metric for streamers, esports clubs, and brands as platforms like Twitch will usually elevate channels with higher watch times.
How to report on hours watched in Blinkfire
Hours watched can be found in Blinkfire’s Streaming Report for both individual posts and over a customizable period of time. This metric is also in Sponsorship Report, Advanced Search and exporting reports.

4. Live Metrics
Total time watched – Live
What this metric is: “Total time watched – live” shows the total time watched during a live stream of an organic video post.
Average time watched – Live
What this metric is: “Average time watched – live” shows the average time watched during a live stream of an organic video post.
Max CCV – Live
What this metric is: Max CCV shows the maximum number of viewers watching a live stream at the same time.
How to report on live metrics in Blinkfire
Live metrics can be found at the post level and when exporting reports. Click on any stream and the live retention graph appears under the video. Underneath the retention graph, you see total time watched and Max CCV (labeled as peak viewers). To get average time watched, divide total time by amount of total viewers.

5. Live Retention
What this metric is: Live retention shows viewership during a video to highlight the increase and decrease in viewership over time.
Tracking live retention helps streamers pinpoint areas with the most and least viewers. Insights from this data can shape streaming strategies to increase views. Live retention makes reporting viewership to partners easier, especially when pinpointing views to sponsored content in a stream.
How to report on live retention in Blinkfire
Live retention data is found at the post level and when exporting reports. Click on any stream and the live retention graph appears under the video. With Blinkfire’s retention graphs, the top line is the viewership and the bottom line represents “chatters,” people connected to the stream’s chat.

6. Subscriber Growth
Growth Rate
What this metric is: Follower growth shows whether Twitch subscribers are increasing or decreasing over a given time period.
Growth Speed
What this metric is: Follow growth speed shows how Twitch subscribers expanded or contracted compared to the previous time period.
How to report on follower growth in Blinkfire
You can track Blinkfire Twitch follower growth and follower growth speed in Blinkfire, including Fan Insights and Media Kit. With these reports, you can view data across other platforms or isolate insights based only on Twitch.

7. Best Time to Stream
What is it: Using past posting history, an automated chart tells you the best days and times to post on Twitch.
If you’ve ever wondered when your audience is watching your streams, wonder no more!
How to find the best time to post in Blinkfire
To find the best time to post on Twitch, go to Media Kit. You can view data based on total or average video views earned during a specific day and time.

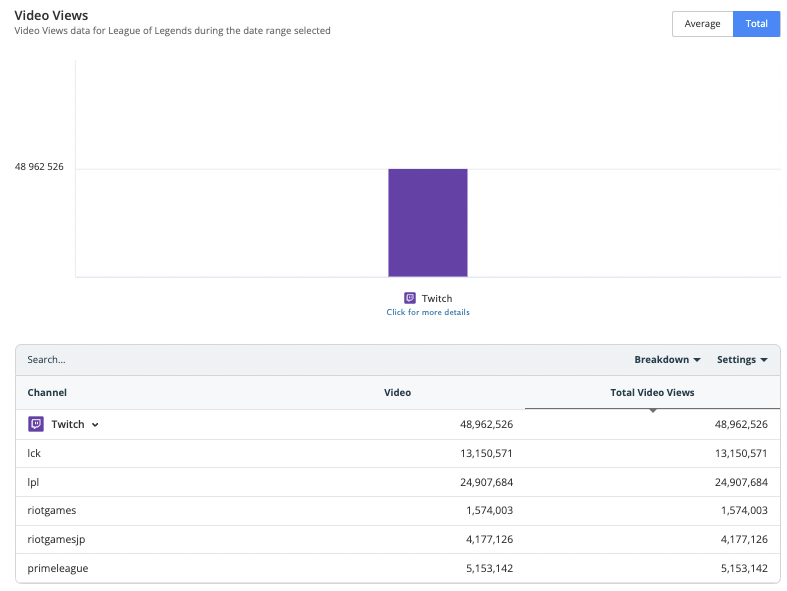
8. Video Views
What this metric is: On Twitch, video views are how many times each viewer accessed your video. This metric counts a “view” as soon as a user accesses the “Watch Page” on Twitch. It does not track whether the video was watched through completion.
How to report on video views in Blinkfire
Video views can be found in Media Kit (by total video views or average videos (total views divided by number of posts). You can also report on video views through other places in the platform like Sponsorship and our Streaming Report.
9. Valuation
What this metric is: Blinkfire values content on a CPM (cost per impression), CPE (cost per engagement) or CPV (cost per view) basis. Twitch is valued by CPV because Twitch posts are videos. Users can set custom CPV values in Blinkfire, or choose to use our industry-standard default values.
How to report on valuation in Blinkfire
Valuation is the bread and butter of Blinkfire — so you can find it across many reports. For overall Twitch valuation, head to Media Kit. If you’re looking for brand partner valuation on Twitch, go to Sponsorship. For Twitch valuation based on an asset (headphones, uniform, chair, or laptop), head over to our Asset Report.

Understanding and analyzing Twitch metrics helps a team build better data-driven streaming strategies. Also, when you track Twitch metrics for sponsorships, it helps show your value to current partners and unlock new opportunities with potential partners.
Track and Report on Twitch Data with Blinkfire
Whether you’re a team, player, league, or organization, tracking and valuing sponsorships across Twitch is essential to maximizing value. Blinkfire empowers partnerships and social media teams with the most accurate, real-time data powered by our patented, proprietary AI technology.
Interested in learning more about how Blinkfire can help track and value your sponsorships on Twitch and other social media channels with advanced data reporting?


No Comment