
10 Instagram Metrics to Track for Success
Data drives insights. Tracking social media metrics, like Instagram metrics, is essential in creating an informed and thoughtful social media strategy in 2023. Understanding which posts create value and how fast your audience grows gives you a leg up in the fast-moving, ever-changing world of social media.
Blinkfire tracks more than 15 social media networks, including Instagram, Facebook, Twitter, YouTube, TikTok, Sina Weibo, Douyin, GIPHY, and LinkedIn. In this blog, we show you how monitoring Instagram metrics and performance lets you and your team know how your content is doing. Without this data, you won’t know how receptive your audience is to a new Instagram-only content series or how a new jersey launch performed.
To make things simple, we listed 10 important Instagram metrics to help you track your followers, review content performance, and increase visibility.
- Follower Growth
- Engagement
- Impressions
- Reach
- Video Views
- Stories
- Best Time to Post
- Valuation
- Paid Data
- E-Score
1. Follower Growth
Growth Rate
What this metric is: Follower growth shows whether an audience is increasing or decreasing over a given time period.
Follower growth can signify an entity’s social media performance. Social media managers try to increase their following. While the number of followers may be considered a less important metric than engagements or impressions, the total number of followers shows an entity’s potential reach.
Growth Speed
What this metric is: Follow growth speed is how an audience expanded or contracted compared to the previous period of time.
Similar to growth rate, growth speed looks at how followers increased or decreased during the previous time period. If follower growth increased in Q4 2022 by 10%, growth speed would compare to Q3 2022’s data. The growth speed is an important insight, especially if you know why growth speed might have risen — for instance: winning a big game or tournament or trading a new player.
How to measure follower growth and follower growth speed in Blinkfire
There are a few places in Blinkfire where you can track follower growth and follower growth speed, including Fan Insights and Media Kit. You can view data across all other platforms or isolate insights based only on Instagram.

2. Engagement
What this metric is: The definition of an engagement varies based on the platform. For example, on Instagram, an engagement is a like or comment. On Twitter, an engagement is a like, comment, or retweet. At its core, an engagement is an action taken. There’s also a difference between public engagements (like, comments, shares) that anyone can view versus private engagements that only the owned and operated account can view (post saves).
The debate of engagements versus impressions is a real one, and we tend to lean towards engagements, as they can be a key indicator of how your audience responds to published content. Engagements are meaningful interactions — rather than simply scrolling past a post, a fan took the time to like or comment.
How to track engagements in Blinkfire
The places to find engagement metrics are endless. For a breakdown of audience data, head over to Fan Insights, where you can see the total number of Instagram engagements broken down by interaction type.
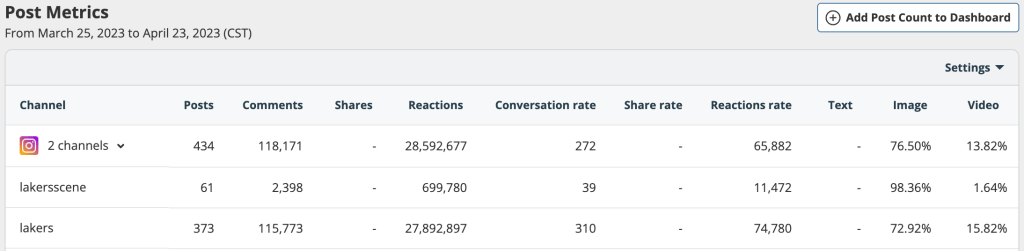
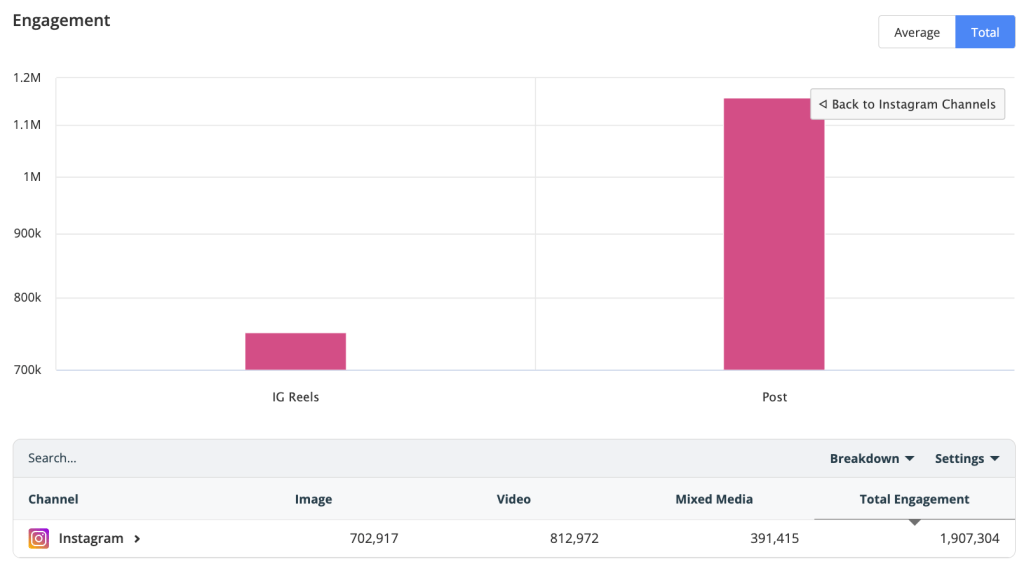
Looking for a more detailed view of your entire social media inventory? Go to Media Kit. Engagements can be viewed a few ways: total engagement or average engagement as well as by content type — Reels or Timeline posts.
If you care more about engagements on a day-to-day basis, Daily Engagement is where it’s at.

3. Impressions
What this metric is: An impression measures how many times a piece of content was viewed. Impressions are always higher than reach because a person can be served the same content more than once. Instagram defines an impression as how many times a person has seen a Story or post.
Impressions play a big role in media strategy, even though they don’t tell you as much about your audience compared to engagements. Impressions can increase your chances for more in-depth exposure, and many organizations still value their content based on cost per impression (CPM). Also, promoted and sponsored posts are measured by the number of times people view your ad (an impression).
How to find impressions data in Blinkfire
Blinkfire offers estimated impressions data for accounts that have not authenticated/logged into our platform. Estimated impressions are based on each platform’s average engagement rates. If a customer has authenticated, they can find impressions data (for their owned and operated accounts) in Media Kit as well as through most reports. Impressions data is displayed by total impressions and average impressions (total impressions divided by the number of posts).
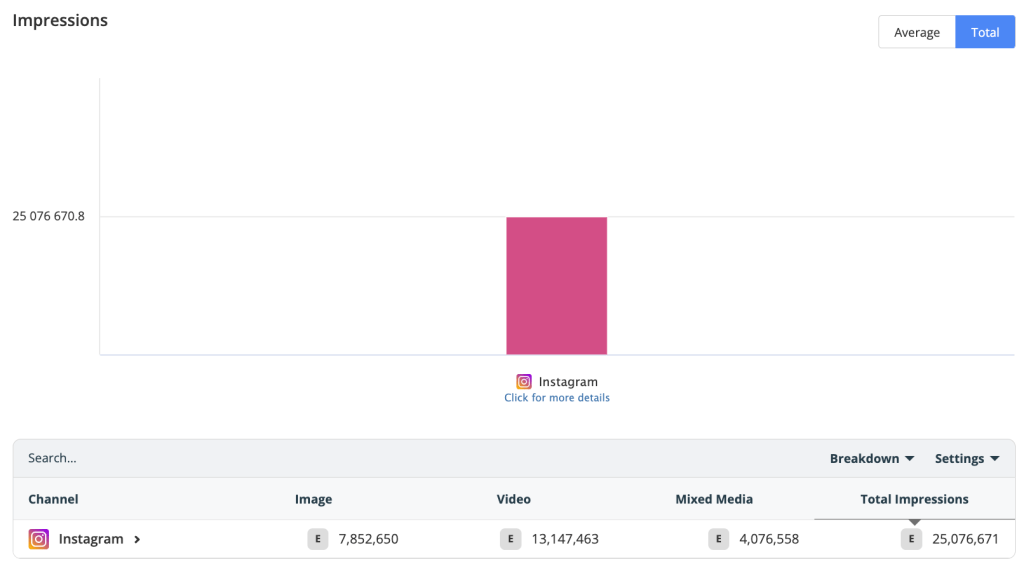
Interested in viewing how impressions data looks between Instagram Reels, Stories, and Posts — that can be done too in Media Kit!

You can also view impressions data on the post level and when exporting reports.
4. Reach
What is this metric: Reach shows how many total people viewed your content. One unique view is equal to one reach metric. Reach is typically lower than impressions.
Depending on your social media strategy, reach might be more important than impressions. If you want to increase brand awareness and engagement, reach could be the metric you and your team want to look at the most.
Reach shows how many unique accounts have seen your content. This translates into how much awareness you are gaining on posts. While this metric will always be less than impressions, it is a more focused metric on the number of people your content is being seen by. Not only is this important for your brand awareness on Instagram, but it can also be an important metric for many potential partners.
How to report on reach in Blinkfire
To view Instagram reach, you must authenticate and login into Blinkfire with your owned and operated accounts. Once completed, Instagram reach data is available in Media Kit based on total and average reach.

Just like impressions, you can also view reach data on the post level and when exporting reports.
5. Video Views
What this metric is: A video view is how many times a video was watched, and each social media platform has its own video view definition. On Instagram, a video view is when a video is watched for three seconds or more, and a video’s view count does not include video loops.
Based on data in Blinkfire, Instagram video views grew 236% in 2022 compared to 2021. Over the past few years, videos have become an integral part of Instagram’s platform, highlighted by the growth of Instagram Reels. Instagram’s push for short-form video is because of consumer demand and competitor success of TikTok and YouTube Shorts. It’ is’s more important than ever to track video views as short-form video content continues to grow.
How to report on video views in Blinkfire
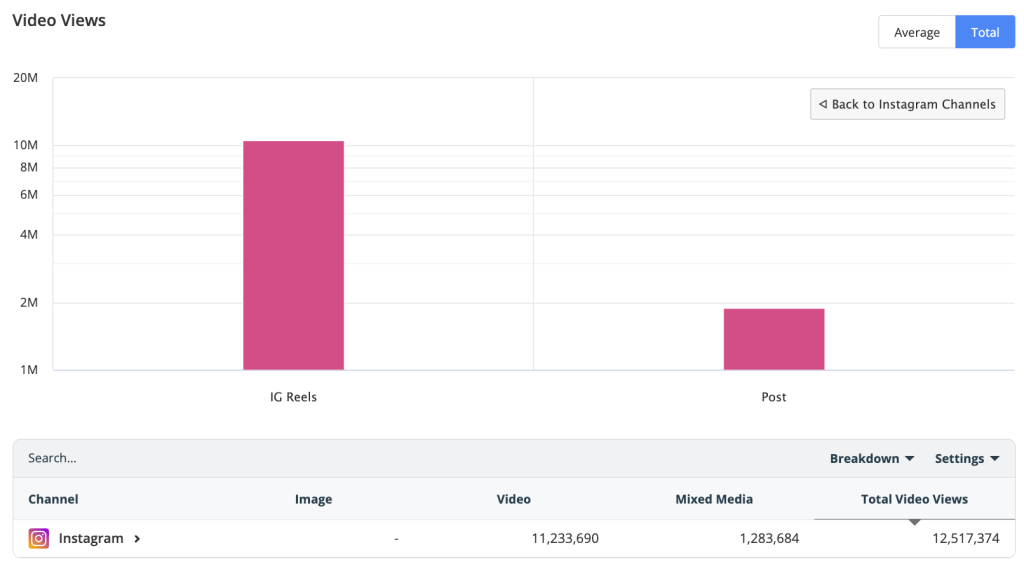
Video views can be found in Media Kit and broken down by total video views or average videos (total views divided by the number of posts).

For a more granular view, we segment total and average video views based on Instagram Reels and timeline posts (images and mixed media — a post with an image and video).
6. Stories
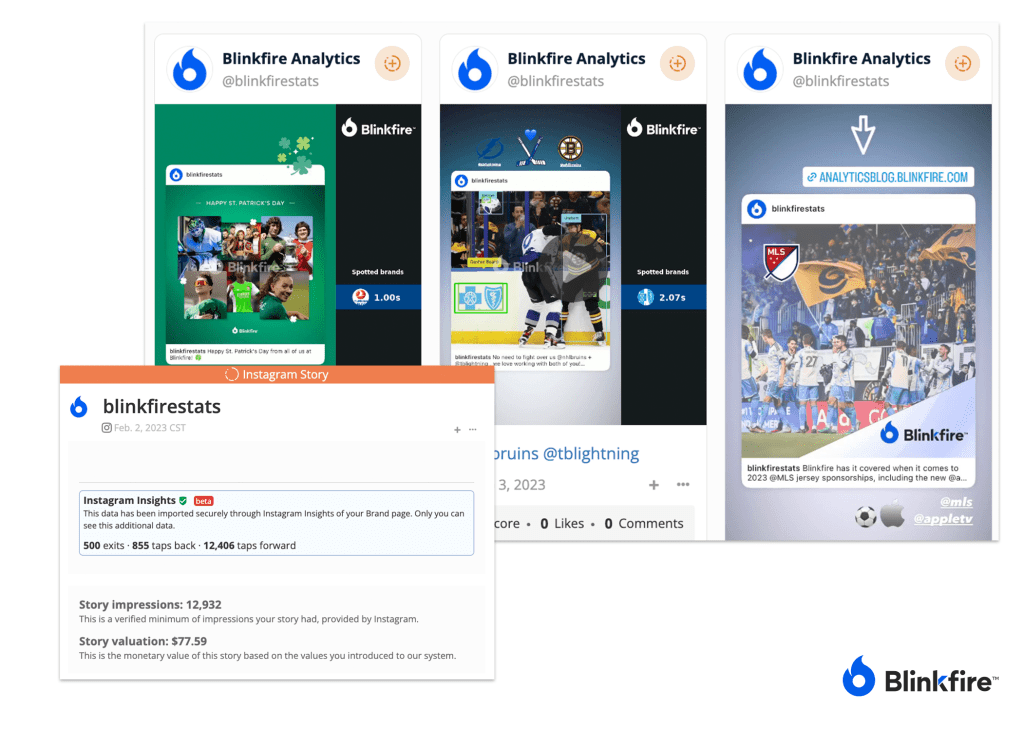
What to track: Instagram Stories are videos or images which disappear from your profile, feed, and messages after 24 hours. Users have the option of adding Instagram Stories to their profiles.
Instagram Stories’ performance is tracked differently than timeline posts. Since there is no real “engagement” on an Instagram Story, these three metrics matter: taps forward, taps backward, and exits. Additionally, impressions are included in Instagram Stories data — how many total views (impressions). Stories are super popular on Instagram, as they offer a quicker and more authentic way for followers to view content. Stories are a great way to get your content in front of followers without them having to visit your page or scroll through their timeline.
How to view Instagram Stories metrics in Blinkfire
Blinkfire has tracked and valued Instagram Stories since January 2018. To track Instagram Stories, a user needs to authenticate and log into Blinkfire with the proper credentials. Stories data is private to the owned and operated entity and available via reports like Sponsorship and Media Kit as well as on the post-level.
7. Best Time to Post
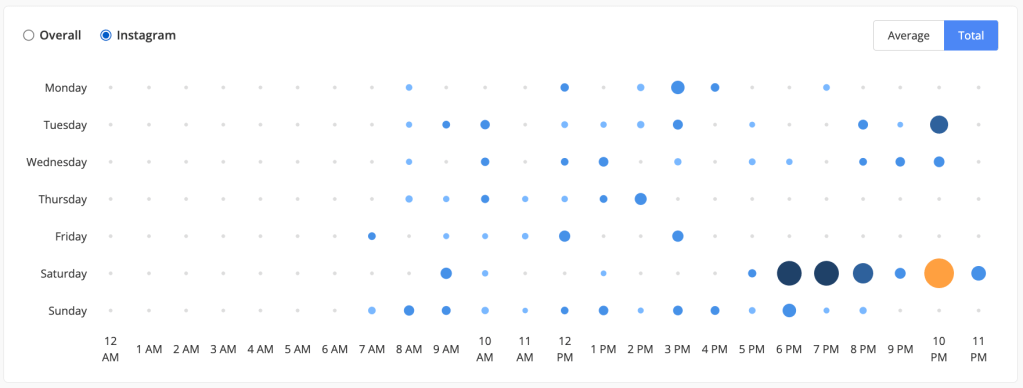
What this tells us: Using past posting history plus interactions, we show a graph of the best days and times to post on Instagram.
Organizations should take advantage of optimal posting days and times. Posting when your followers are most engaged can increase your chances of reaching fans. Scheduling posts can help make sure your content gets out at the right time.
Where to find it in Blinkfire
To find the best time to post on Instagram, go to Media Kit. You can view data based on the total or average engagement received on a specific day and time.
8. Valuation
What this metric is: Blinkfire values content on a CPM (cost per impression), CPE (cost per engagement), or CPV (cost per view) basis. Instagram Stories are valued by CPM, and Instagram timeline posts can be valued by CPE, CPM, or CPV.
By tracking valuation, social media teams can understand the media value of their content, which is essential when creating profitable partnerships.
Finding valuation in Blinkfire
Valuation is pretty much everywhere — as that is one of Blinkfire’s core components. For overall Instagram valuation, head to Media Kit. Valuation can also be viewed by total valuation and average valuation (total valuation divided by the number of posts) as well as by Instagram channel, if you’re a team with multiple Instagram handles.

If you’re looking at brand partner valuation on Instagram, go to Sponsorship. For Instagram valuation based on content series, Scene Report is your answer, and if you want to track valuation based on an asset, Asset Report. Below is an example of how valuation looks on the post level.

9. Paid Data
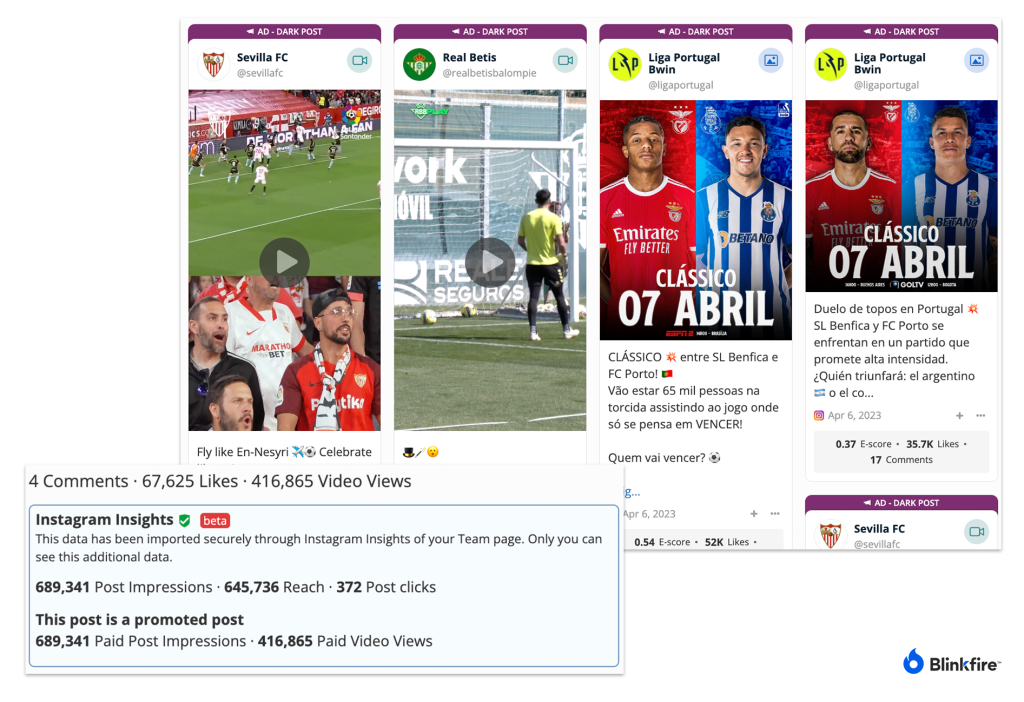
What paid data tells you: Paid Instagram data consists of either an Instagram promoted post (timeline post with money behind it) or an Instagram dark post/Story (an ad that does not live on a timeline feed or Story feed). With paid data, you can view the paid impressions for boosted posts and paid impressions and video views for dark posts.
Finding paid data in Blinkfire
Paid data can be found using Blinkfire’s Advanced Search Tool, Sponsorship Report, or through report export.
Boosted Posts

Ads / Dark Posts
10. E-Score™
What E-Score™ tells you: Blinkfire’s E-Score™ is short for “Engagement Score,” that measures the rate of engagement a post has earned rather than the absolute number of engagements. The number of post engagements most often depends on the number of followers a team has — for example: a team with 10 million followers will more than likely earn more engagements on a post than a team with 1 million followers, and their content will appear to trend faster and be more popular, when that may not be the case.
Find E-Score™ in Blinkfire
E-Score™ can be found on the card view and the post-level view as well as when exporting data.

Instagram has numerous metrics that offer social and content teams the best way to understand performance. By understanding what the data is, you can better utilize Instagram to grow and engage your fans.
Track, value, and grow Instagram with Blinkfire
If Instagram is part of your social media strategy, we’re here to help! Whether you’re a team, brand, or influencer, Blinkfire’s Instagram and social media tracking gives you the insights you need to grow your audience and build new partnerships.


No Comment